Jan 30 2021
Of Bubbles and Arrows
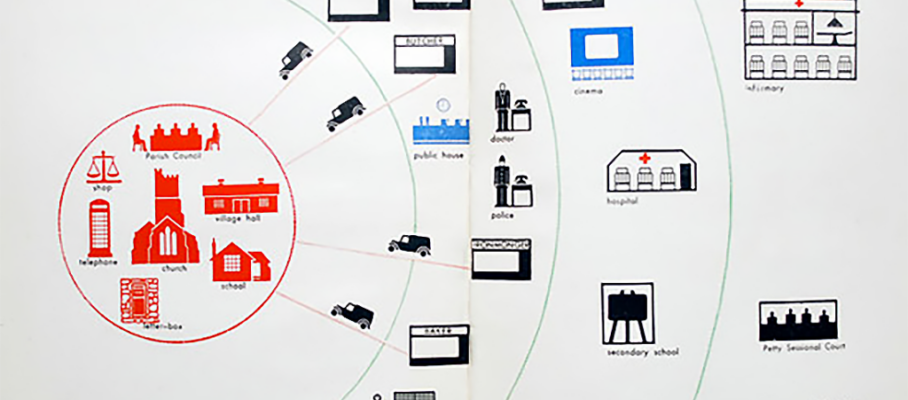
[The featured image is an ISOTYPE from Marie Neurath (1936)]
Maps of symbols connected by lines are the most common form of graphic communication about operations, next to bar charts, pie charts, and time series. The symbols may be a variety of pictograms and there may be different types of lines, including arrows, double-headed arrows with a variety of arrowheads, with dashed lines of varying thicknesses…
This is about what you can do with such maps beyond communicating, and the challenges of mapping systems that don’t fit on one slide. It is also about improving current practices.

 “This year is the 20th anniversary of the founding of the Lean Enterprise Institute (LEI). There will surely be a big celebration. But in my view, there is less to celebrate than meets the eye. Here’s why:
 I share your reservations about the many “Houses of Lean” floating around, but my main concern with them is vagueness. The descriptive versus prescriptive confusion that you bring up is one concern. In one diagram I am looking at right now, “Heijunka” sits on top of “Stability” and underneath “Pull System,” “Takt Time” and “Continuous Flow.” Whatever it is intended to mea
Dec 30 2023
Greatest Hits of 2023
This blog’s greatest hits of 2023:
#greatesthitsof2023, #quality, #VSM, #ValueStreamMap, #deming, #toyota
Share this:
Like this:
By Michel Baudin • Uncategorized 1 • Tags: Deming, Greatest hits of 2023, Quality, Toyota, Value Stream Map, VSM