
Oct 25 2013
Where do “Value Stream Maps” come from?
I have been wondering where this tool actually comes from. In the introduction to Learning to See, Mike Rother describes it as a minor tool known within Toyota as “Material and Information Flow” mapping. I have many books about TPS in English and Japanese, of vintages ranging from 1978 to 2009. They contain all sorts of charts and flow maps, but nothing that resembles a VSM. I found the following in my library:
- In Monden’s 1993 “Toyota Production System” book, there is a diagram on p. 59 about the circulation of supplier kanbans with symbols that resemble the VSM’s.
- The 2005 Nikkan Kogyo book about the Nissan Production Way ( 日産生産方式キーワード25) on pp. 20-21 has a material and information flow diagram of the entire car manufacturing process with numbered captions that point to sections of the book with details on each. It uses 3D pictograms specific to car making.
- Mikiharu Aoki’s 2012 “All about car plants” (自動車工場のすべて) uses a similar approach to the Nissan book, with simpler graphics.
- The June, 2007 issue of the Kojo Kanri magazine (工場管理. or Factory Management) has a series of articles on the application of TPS in process industries, and includes a material and information flow diagram on p. 24.
- On the Toyota Global website John Gore found an Illustration of the Toyota Production System that works as a road map to more detailed information, like the diagram in the Nissan book.
The pictures are in the following gallery (Please click to see them in full size):


None of these examples have the purpose, focus, or ambition of VSM. Their purpose is to explain, not to document a current state or design ideal and future states. They don’t use a standard graphic language, and are not bound by the strictures of VSM. For example, having a double timeline at the bottom constrains you to showing all operations as a sequence. People often struggle with this, because real material flows usually involve merging and branching, and it don’t fit above a single line.
All the examples above make full use of the two dimensions of the page and don’t attempt to show a timeline. To look further, I googled “物と情報の流れ” (Materials and Information Flow) for Japanese images, and found, again, all sorts of other charts, but also a couple of Japanese sites containing VSMs, such as ITmedia and Monoist where they are called “Value Stream Maps” (バリューストリームマップ), and the references given are Japanese translations of American books, mostly from the Lean Enterprise Institute (LEI).
I found this puzzling. Were these charts a Toyota trade secret that Rother and Shook leaked, or were they actually invented in the US and attributed to Toyota? Assume a celebrity went from overweight to lean and athletic in 90 days, and an approach or product is being marketed as what this person used to do it. The truth of this claim matters if you consider buying it. VSM is marketed as a basic tool of Lean, and just about everybody assumes it means that it was developed within Toyota and is widely used in its operations.
This belief is essential to the credibility of VSM to many managers who may not even know how to read one. If it is not really from Toyota, it can still be a great tool, but you cannot invoke Toyota’s authority to promote it. It must stand on its own merits. To get to the bottom of this, I asked members of the TPS Principles and Practice discussion group on LinkedIn, and received many enlightening answers from Bryan Coats, Erik Stordahl, Frederick Stimson Harriman, Zane Ferry, Jerry O’Dwyer, Peter Winton, Chet Marchwinski, Bret Bakensztos, Paul Todd, Salvador D. Sanchez, and Gary Stewart. In addition to their personal inputs, they also provided links to publications on this topic by Hajime Ohba, Mike Rother, and Art Smalley. I have organized their inputs as follows:
- Origin in Toyota’s Operations Management Consulting Division (OMCD)
- Materials and Information Flow Analysis at TSSC
- The “Value Stream Mapping” Label
- Art Smalley’s perspective on VSM
- Materials and Information Flow Mapping in My Own Work
- An Example from 1918
Comments are welcome on any point that I missed or did not present accurately and completely.
Contents
Origin in Toyota’s Operations Management Consulting Division (OMCD)
The Toyota alumni confirmed that you rarely see a Materials and Information Flow diagram (VSM) within Toyota, and explained that the tool was developed at Toyota’s Operations Management Consulting Division (OMCD), for selective use with suppliers — that is, wherever the main issue is with flows of materials and information related to these flows.
The OMCD, whose Japanese name actually means “Production Investigation Division” (生産調査部). As far as I know, this is a group of 55 to 65 high-level TPS experts supporting a company of >350,000 employees. The technique was brought to the US by the Toyota Supplier Support Center (TSSC). In parallel to TSSC, according to both Frederick Stimson Harriman and Zane Ferry it was also introduced by consultants from Shingijutsu, who also used it selectively and never used the term “value stream.” The Lean Enterprise Institute‘s Chet Marchwinski added the following details and corrections:
“According to John Shook, Materials and Information flow diagrams were created by Toyota’s OMCD group. They were introduced to the U.S. by TSSC, not Shingijutsu, and ultimately made their way to the Lean Enterprise Institute. Here’s how.
Jim Womack and Dan Jones introduced the concept of “value stream” and in Lean Thinking told readers to map them. While the book had an example and descriptions, the process wasn’t laid out. At that time, Mike Rother had just become very interested in Toyota’s M&I flow mapping so John introduced him to Jim and Dan. He said Dan was especially interested in M&I mapping too.
Mike was the lead author (John is co-author) of the workbook Learning to See and developed the mapping workshop. Dan came up with the title Learning to See. Jim and Dan coined the term “value stream” and “value-stream mapping.” More importantly perhaps, the reason why there are little or no references to the tool in Toyota materials is that Toyota never taught it widely.
John said it was and still is used by the select group of TPS experts, mostly in the OMCD organization. (I think it is now Operations Management and Development Division.) So, the tool came to LEI in a roundabout way from TSSC, according to John.”
It is clear from Learning to See itself that the authors just thought of it as a useful tool and did not intend to oversell it. Their introduction says it all:
“John (Shook), has known about the “tool” for over ten years, but never thought of it as important in its own right. As john worked with Toyota, mapping was almost an afterthought — a simple means of communication used by individuals who learn their craft through hands-on experience. At Toyota, the method-called ‘Value Stream Mapping’ in this workbook isn’t used as a training method, or as a means to ‘Learn to See.’ It is used by Toyota Production System practitioners to depict current and future, or “ideal” states in the process of developing implementation plans to install lean systems. At Toyota, while the phrase ‘value stream’ is rarely heard, infinite attention is given to establishing flow, eliminating waste, and adding value.”
That Rother and Shook never intended to make VSM a standard tool that every Lean implementation team is mandated to use as a starting point is further documented in interactions some discussion participants had with them. Bret Bakensztos, for example, reports explaining to Mike Rother how his team had abandoned certain concepts described in Learning to See in order to make the tool provide the information we needed.
Mike Rother’s response had been “Cool!” I am not surprised by this reaction. The people who develop or even introduce a tool are usually open to other people’s adaptations or enhancements. They understand their own tools too well to want to turn them into rigidly enforced, creativity stifling “standards,” as bureaucracies are wont to do.
Materials and Information Flow Analysis at TSSC
TSSC still teaches Materiasl and Information Flow analysis. I found the following announcement on their website:
“Material & Information Flow: day in classroom designed to develop the skill to document the current condition and locate the process bottleneck. 1 day shop floor focused on grasping the current condition and finding the bottleneck in an actual shop floor setting.Length: 1.5 days”
The announcement does not paint it as a universal tool to be applied first in every plant as a means of identifying waste removal opportunities. According to Erik Stordahl:
“Materials and Information Flow diagramming was never, ever intended to be the first step in implementing TPS. In fact, in Toyota, I’ve always seen it as nearly a last step, well after tooling diagrams, machine design, standardized work, job instruction, and many, many other documents.”
That this tool is not universally applied even in supplier development is also documented in the Stanford Business School case study of Johnson Controls that Bret Bakensztos pointed out. Paul Todd provided a link to a presentation by the first leader of TSSC, Hajime Ohba at the 2002 AME Conference, in which he explicitly recommends against using VSM as a starting point.
Paraphrasing him in a different vocabulary, what he saying is that you should start at the micro level — machines, cells, workstations, tooling, fixtures, operator job design, etc. — not at the macro level — lines, departments, suppliers, customers, etc. His reasoning is that you need to develop skills before you can address macro level issues. And he is saying that you should not start with VSM because it is a macro level tool. What Ohba does not say in his presentation is how you find out where in the plant you should start at the micro level. To me, an appropriate pilot project must meet the following conditions:
- It must provide an opportunity for tangible, short-term performance improvements.
- Both management and the work force in charge of the target process must be willing and able.
- The target process must have at least one more year of economic life.
To identify such opportunities, you need to observe operations directly, interact with operators, managers and engineers, and analyze data. VSM is one of the tools that are useful in doing this, but it is not the only one, and it is not always needed. NUMMI and TSSC alumnus Salvador D. Sanchez recounts his personal experience with this tool as follows:
“The first time I saw MIFD (Materials and Information Flow Diagrams) was when I started working at NUMMI in 1990. I was working with a Toyota coordinator. who was a team leader. He was explaining to me as a team member how a truck was built. He couldn’t speak English and I couldn’t speak Japanese but we communicated using this tool. After that I did not see another one till 9 years later when I started a 3 year assignment at TSSC. I was working with Cindy and Ohba-san at the time and we were working with a supplier.
During my time there I used this tool many times but only when I needed to. During that time we were also training Toyota Managers by taking them to suppliers and did a hands-on activity which involved one week of process kaizen and one week of system kaizen. During that week we used MIFD. Later on they started using it more and more in the plants only when needed.”
The “Value Stream Mapping” Label
“Materials and Information Flow” accurately describes what the technique is about, and is almost self-explanatory. I say “almost” because there are plenty of information flowing in manufacturing operations that does not appear on a VSM, such as providing and updating work instructions, downloading process programs, uploading sensor readings and measurements, etc. The only information flows that appear on a VSM are for Production Control: orders, forecasts, schedules, kanbans, etc.
According to Gary Stewart, a 23-years Toyota veteran:
“The VSM process was known internally simply as “process mapping” – (or occasionally later as MIFD – but that was more specific to OMCD ) – it is only one of a suite of tools that should be used together to understand the process from high level to great detail. I think today the term VSM and the use by consultants of the term VSM is much more a response to creating a branding difference in both Marketing and Consulting. In Marketing “process mapping” does not sound very sexy – nor could you different yourself from every other consultant. But with Value Stream Mapping – you have a major brand differentiator.
I say this because I find that many Toyota techniques that internally have no “official” name – or a very simple name or descriptor – have mysteriously developed new “brand names” when they appear outside of the Toyota world. […] Today I use “process mapping” and VSM interchangeably – personally I have no problem with the rebranding of Toyota’s simple name words and descriptors into more recognisable “brand names”. In the end it is not what they are called – but how you use them that matters. The actual form is completely unimportant – it is the use of the philosophy behind the format ( and the name) that is important.”
Unquestionably, Jim Womack is an outstanding marketer. “Process Mapping,” “Materials and Information Flow Analysis,” are all terms that, at best, appeal to engineers. Any phrase with “value” in it, on the other hand, resonates with executives and MBAs.
They readily latch on to a concept called “Value Stream Mapping,” even though their eyes would glaze over at the sight of an actual map. While this confusingly abstract vocabulary can be frustrating to engineers, it does serve the vital purpose of getting top management on board. The trick is to know when to use it — in the board room — and when not to — on the shop floor.
Art Smalley’s perspective on VSM
With permission from Art Smalley, here is what he wrote about VSM in his 2005 article:
“Value stream mapping, for instance, is perhaps the most widely used tool in lean programs today. The prevailing assumption in virtually every plant is that a value stream map must be drawn for each product family, a value stream manager anointed, and that it will somehow magically reveal all of the plant’s problems. This practice has become a sort of litmus test for Lean.
If there is no value stream map and an associated tracking center, then the company is not pursuing true Lean manufacturing. But there were no value steam maps in the Toyota facility in West Virginia, nor are there value stream managers. And this is hardly because Toyota employees are so smart they all carry the value stream maps around in their heads.
The reason there are no value stream maps in most Toyota plants is very simple in hindsight. It was a tool developed primarily as an analytical aid to look at material and information flow problems in certain processes. In fact, the actual name of the tool at Toyota is “material and information flow analysis” – not value stream mapping.
A third dimension, human motion, is often added to the mix for consideration as well at Toyota. As TPS evolved internally and was rolled out to supplier companies externally a consistent problem was insufficient investigation into the details of material flow, information flow, and human motion in the process.
A typical layout drawing, for example, simply does not emphasize these aspects clearly enough to bring problems to the surface. Once production starts, it is too late or costly to fix some of these items. In response a creative countermeasure was developed that became a requirement for engineers and others in charge of manufacturing processes and line conversion work at suppliers.
The emphasis was to draw both detailed standardized work charts depicting operator motion, and flow charts depicting material storage locations, scheduling points, and operator work sequence before the start of production. In other cases, this tool was used externally to find ways to convert lines to more efficient ones.
The key point is that the tool was created to analyze and solve a specific category of problems Toyota faced in new production lines and in helping suppliers implement lean. From this fairly specific local origin in Toyota, the tool was slightly modified (the human motion emphasis was reduced) and popularized in the U.S. by my good friend and former Toyota colleague John Shook, and his co-author Mike Rother, in their insightful, best selling workbook “Learning to See”.
The title of the work I think is important. Originally the authors had considered titling the workbook Material and Information Flow Analysis for Lead Time Improvement and Work Place Kaizen. This name, which would have been truer to the original intent of the material, was changed for marketing reasons to “Learning To See”. The workbook went on to sell over 125,000 copies, and has affected the direction of lean efforts in the U.S. more than any single publication.
Unfortunately the object of what the workbook urges the reader to see is not as clearly communicated in the catchier title – and here is where the law of unintended consequences kicks in. The book is about learning to see what is primarily a material and information flow problem, or essentially elements of the JIT pillar of Toyota’s production system (flow, takt time, level, and pull production).
By design it doesn’t even attempt to address the topic of Jidoka for example which Toyota considers an equally if not more important support pillar than JIT or equipment stability. The technique used in the workbook simply measures the overall manufacturing lead-time versus production value add time. Everything non-value adding (i.e. the waste) is to be eliminated and answering seven specific questions outlined in the workbook will help you accomplish some of this goal.
Overall, however, when the 4M’s of manufacturing (man, machine, material, and method) are considered you’ll realize that this tool mainly considers the material (and information) flow component. The other 3M’s are much less emphasized and one other important M – metrics – is expressed chiefly in terms of lead-time and value-add time.
This is fine for Toyota. Internally they well know the limits of the tool and understood that the it was never intended as the best way to see and analyze every waste or every problem related to quality, downtime, personnel development, cross training related issues, capacity bottlenecks, or anything to do with profits, safety, metrics or morale, etc.
No one tool can do all of that. For surfacing these issues other tools are much more widely and effectively used. Unfortunately, the average user of the workbook tends to copy the pattern expressed in value stream mapping regardless of the nature of their manufacturing problems.
The unintended consequence of the success of the method has been to convince many people that it is a universal tool for identifying all problems in manufacturing operations. Marketing hype helps reinforce this notion. “Just draw a value stream map and it will show you all your problems to work on” is a popular refrain that I hear quoted in companies attempting lean.
This guidance however biases companies with major quality, downtime, or factor productivity problems to deemphasize them since those items are not surfaced well using the method and questions outlined in value stream mapping. The tool just does not frame these problems well by design. Couple this effect with the fact that most lean efforts already have a disproportionate bias towards the concept of “flow”, and there is a recipe for inherent danger.
For example instead of learning to see what is truly broken in their processes companies wind up typically focusing on a particular subset of operational problems chiefly that of flow and lead-time related issues.”
Materials and Information Flow Mapping in My Own Work
The idea of Manufacturing as a three-layered flow system of materials, information, and money occurred to me when I was writing my first book, Manufacturing Systems Analysis, in the late 1980s, and I thought it important enough to put the following diagram on the cover:

What VSM does is show the production control part of the bottom two layers on the same diagram, which I only did in cases where the two are tightly coupled, for example in the dual-card Kanban system. The following is on pp. 312 and 314:

I used a simpler and more abstract graphic notation than VSM, and complemented the flow diagram with a state-transition diagram focused on what happens to a Kanban through the cycle. Working at the time on software development for Manufacturing Execution Systems (MES), I had found a formal similarity between the ASME symbols for process mapping and Tom DeMarco’s for data flow diagramming.
Materials and information, however, do not flow the same way. For example, once you retrieve materials from a warehouse, they are no longer there, and the inventory needs to be updated accordingly; on the other hand, no matter how many times the same data is read from a database, it is still there. When showing both types of flows on the same chart, it is therefore vital to use symbols that let the reader tell them apart, and VSMs do.
An Example from 1918
A few year ago, Bryan Lund pointed out to me a 1918 book by Charles E. Knoeppel entitled Installing Efficiency Methods, and I managed to buy a used copy from the Iowa State University Library that had last been returned on August 5, 1939. In the chapter on Diagnosis, I found the two following charts, respectively showing flows of materials and information in a factory. These are the earliest examples I know.


October 25, 2013 @ 11:06 am
One aspect of what and how to map that has not been mentioned in any of the posts, is that recommended by Shigeo Shingo. In almost every book, Shingo presented his “process vs operation” map. As used by Shingo, a process is the transformation of raw materials into finished goods, and an operation the interaction of man, materials, and machinery. Shingo cautions against improving an operation before examining the process as a whole, in case the operation can be eliminated completely. An example is transportation: do you need a faster/higher capacity forklift, or do you need to store the material next to where it is actually used, thus eliminating the forklift altogether. Shingo’s process mapping used standard process flow mapping symbols, but can easily be carried out with VSM symbols. Operations mapping is often done with “spaghetti” diagrams. Whether Shingo used any of these mapping tools in his consulting activity at Toyota is not mentioned in his books, but given the fact that they are shown in many of his books, one would have to assume he felt they are central to improvement planning.
October 25, 2013 @ 11:18 am
Unless I am missing something in Shingo’s work, I don’t see diagrams that show flows of both materials and information at the production control level. I see him as focused on the engineering of production lines, a level of detail on flows of materials that is not shown in VSMs, where a single operation box may represent an entire welding shop. Shingo looks at the details of machine locations and orientation.
October 26, 2013 @ 8:42 pm
Comment in the TPS Principles and Practice discussion group on LinkedIn:
October 28, 2013 @ 6:34 am
Comment in the Lean CEO discussion group on LinkedIn:
October 28, 2013 @ 6:45 am
Comment in the Lean Manufacturing & Kaizen discussion group on LinkedIn:
October 28, 2013 @ 6:51 am
Comment in the Lean Six Sigma Worldwide discussion group on LinkedIn:
October 28, 2013 @ 6:57 am
Comment in the Lean & Kaizen discussion group on LinkedIn:
October 28, 2013 @ 6:59 am
I am not familiar with Allen Morgenstern. Process mapping and VSM differ in two essential ways:
October 28, 2013 @ 7:01 am
Comment in the Lean & Kaizen discussion group on LinkedIn:
October 28, 2013 @ 12:15 pm
I see many similarities between IDEF0 and VSM, so maybe IDEF0 among other mapping models has inspired what we know as VSM?
October 28, 2013 @ 1:50 pm
As I understand it, IDEF0 is a mapping convention for information flows only. So, again, what makes VSM different is that it shows flows of both materials and information on the same chart, at a level of detail that is less on each side than in diagrams that only show one of the two. Following is the example given in Wikipedia:
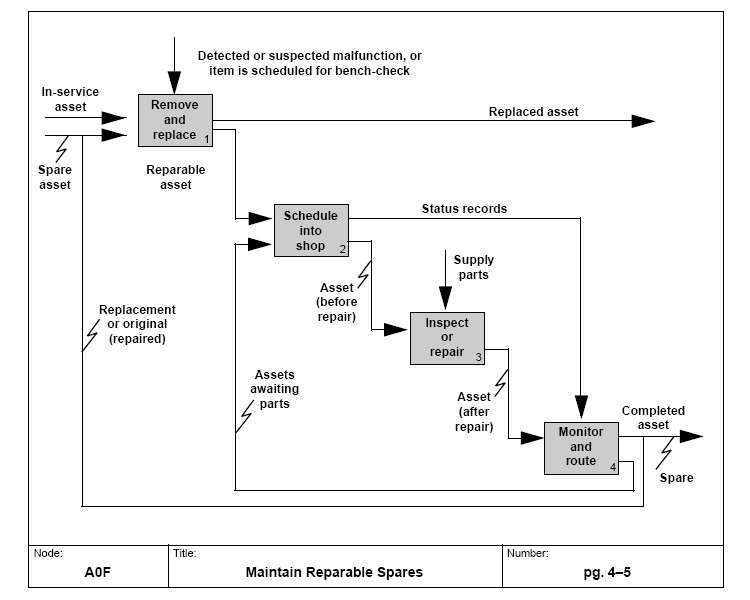
The captions refer to assets that are repaired or replaced, but they mean data about the assets — like ID, model number, date of last maintenance check, etc. — not the assets themselves. By contrast, trucking arrows on a VSM represent physical trucks delivering to of shipping from the factory.
May 16, 2016 @ 9:34 am
Hallo,
Very interesting article!
I would like to add something to the discussion about IDEF0 though. As I just read the IDEF0 manual (link available on WIKI page) yesterday, I would argue that by “data”, the authors of IDEF0 did not just mean information but in their own words: “‘Data’ may be information, objects, or anything that can be described with a noun phrase”. In fact, IDEF0 is intended to capture manufacturing system’s functions and the objects and information interrelating these functions.
In this context I can suggest the paper “Using the Structured Analysis and Design Technique (SADT) in Simulation Conceptual Modeling” from Ahmend, Robinson, and Tako 2014. IDEF0 is based on SADT as far as I understand — they are very similar.
Best regards,
Sebastian
May 16, 2016 @ 10:32 am
In the VSM context, “information” is used to mean “data,” two concepts that are often conflated. Generally, I don’t. Data is whatever is read or written; information, what an agent learns as a result of reading data. If you read the same data twice, you don’t get twice the information. In fact, the only case in which the second reading gives you any information is when you have forgotten something. Information is therefore a quantity attached to a read event.
When you put flows of data and materials on the same chart, you need to distinguish them because the operations you do on materials are fundamentally different than the ones you do on data. Once you have read data, it is still where it was. You have, in effect, copied it. But once you withdrawn materials from a store, they are no longer there. Confusing reading data and withdrawing materials is not a good idea.
2nd Journal Entry | Lindsey Rae's MBA
October 28, 2013 @ 5:26 pm
[…] Where do “Value Stream Maps” come from? (michelbaudin.com) […]
October 31, 2013 @ 6:05 am
Comment in the Global Lean & Six Sigma Network discussion group on LinkedIn:
Management Improvement Carnival #201 » Curious Cat Management Improvement Blog
November 1, 2013 @ 7:03 am
[…] Where do “Value Stream Maps” come from? by Michel Baudin – “Toyota alumni confirmed that you rarely see a Materials and Information Flow diagram (VSM) within Toyota, and explained that the tool was developed at Toyota’s Operations Management Consulting Division, for selective use with suppliers” […]
November 2, 2013 @ 12:46 pm
Comment in the Continuous Improvement, Six Sigma, & Lean Group on LinkedIn:
November 2, 2013 @ 12:51 pm
Comment on LinkedIn:
November 4, 2013 @ 6:42 pm
Another very educational and useful post from Michel Baudin. Thank you very much.
I’d like to add that the Installing Efficiency Methods book can be read online for free and downloaded in various formats from archive.org:
https://archive.org/details/installingeffic00yorkgoog
November 5, 2013 @ 5:42 pm
I have this little book called “The Memory Jogger” a pocket guide of tools for continuous improvement written in 1985 for Ford. Dr. Edward Deming was one of several authors. The others are: Ishikawa, Shewart , Grant, Beaverman and Duncan. on page 6 it goes into detail how a process “Flow Chart is to be used and explains it identifies the actual and ideal path that any product or service follows in order to identify deviations. There are two models given, the 4M’s for manufacturing and the 4P’s for administrative /service flow charts…The last source I forgot to mention is the Statistical Quality Control Handbook, Western Electric Co., 1956. Walter Shewart’s book, “Economic Control of Quality of Manufactured Product” goes back to 1931…Kaoru Ishikawa book called “”Guide to quality control from Asian Productivity organization, Tokyo. 1982. These little hand books were distributed to many Ford managers in 1985 as part of the G.O.A.L training and written and paid for by Ford Motor Co. I still have and use my book today…
Standards and Opportunities for Deviation | Michel Baudin's Blog
November 6, 2013 @ 9:55 pm
[…] Value Stream Mapping (VSM) has, in the past 15 years, been elevated in the US to the position of a standard that all Lean […]
January 6, 2014 @ 7:14 pm
Comment in the Operational Excellence discussion group on LinkedIn:
January 6, 2014 @ 7:16 pm
@John — Of course, we should use tools regardless of source, as long as they do the job we need them to. There is nothing wrong with using a tool not invented by Toyota. What I object to, on the other hand, is convincing people to use a tool because Toyota does when in fact it doesn’t, or at least not systematically, and not in its own operations.
I find VSM to be a good visualization tool for logistics and production control in small to medium-size manufacturing systems and supply networks. It doesn’t show the engineering or the human aspects of production, and it doesn’t scale up well to complex, multi-tiered systems.
It’s just a mistake!?! | Kurt Spencer's Take on Product Design
March 8, 2014 @ 1:13 pm
[…] what is the message here, don’t make mistakes? No, that is a silly statement to make, in the CPI world any post-it note that says ‘do better’ is thrown in the trash. Mistakes occur from a variety of reasons; some preventable, some not, some caused by typhoons, […]
Lean-Lite versus Lean-Deep: Interview with Michel Baudin
October 15, 2014 @ 9:11 am
[…] Can it be useful in other contexts? Absolutely. Should it be a mandatory first step in every Lean implementation? Absolutely not. It is not a big deal in Japan, and the only publications about it in Japanese are actually translations from American documents. For more details see “Where do VSMs come from?“. […]
October 23, 2014 @ 10:55 am
Hi Michel. Thank you [(and the other contributors (Smalley)] for your well researched, and well-detailed history of VSM. I am writing a thesis in the health sciences field, and thought it would be “easy” or “less of a challenge” than other literature reviews to find the history of this concept. I, of course, should have known better. The history you’ve provided helps me write the background I need on this topic and I appreciate that very much.
Ciao, jessica
Lean Book Review | Value Stream Mapping by Karen Martin and Mike Osterling
December 1, 2014 @ 7:15 am
[…] from a number of primary sources into a concise yet thorough historical summary in the blog post, Where Do “Value Stream Maps” Come From? Do check it […]
June 1, 2015 @ 12:20 am
Well. apparel industry uses them a lot. VSM diagrams can be drawn with a software called creately and it is the best diagramming software on the cloud. it is also well known for drawing flowcharts .
When to do Value Stream Maps (and when not!) | AllAboutLean.com
July 28, 2015 @ 1:24 pm
[…] Efficiency Methods included diagrams very similar to modern value streams (Thanks, Bryan Lund and Michel Baudin for digging that and other details […]
December 16, 2016 @ 9:06 am
I was on a tour at Toyota Kentucky and someone asked where their VSM were located. The tour guide said we don’t do VSMs!
Why do we call it “value stream”? | Michel Baudin's Blog
November 22, 2017 @ 5:18 pm
[…] For a detailed discussion, see Where do “Value Stream Maps” Come From? […]
December 30, 2023 @ 4:35 pm
Being an Industrial Engineer, I know of a complete set of charts that can be used to start by representing a product BOM and go to the end result of a Gantt Chart that shows the schedule for producing the product. In contrast, VSM is at best a visual explanation and depiction of all the individual systems an d processes that constitute a production system. Otherwise useless. As for the steps to achieve a Future State, they are a hodgepodge of ideas pulled from the TPS and Lean BoK. Given that the Lean “experts” like Rother and Womack and Liker are not Industrial Engineers, Lean is a master example of plagiarism without innovation, insight or invention. Lean owes its existence to a clever association with the TPS to have legitimacy. If I were you, I would start learning about Industrial Engineering to learn what Lean and TPS lack. Just because you worked at Toyota does not make you a good Industrial Engineer! In fact, all the popular Toyota retirees turned Lean experts demonstrate major gaps in their knowledge. I wonder if anyone of them understands the limitations of the TPS. I would love to sit all of them down and explain how much IE would improve the TPS now that TPS taught me to be a better IE.