Sep 25 2013
The Term “Lean Production” is 25 Years Old – Some Thoughts on the Original John Krafcik Article | Mark Graban
See on Scoop.it – lean manufacturing
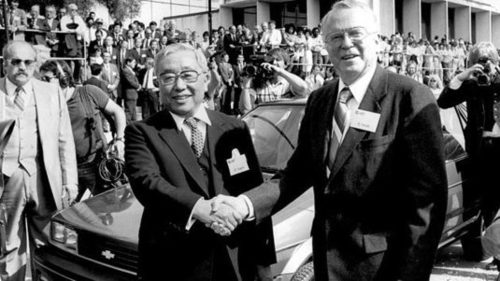
 “The term “lean production” arguably was first used in a MIT Sloan Management Review article by John Krafcik that was published 25 years ago this fall (Fall 1988), titled “Triumph of the Lean Production System.” In the 1980s, Krafcik, who worked with The Lean Enterprise Institute’s Jim Womack in the MIT International Motor Vehicle Program is now president and CEO of Hyundai North America.”
Michel Baudin‘s insight:
Mark Graban’s throughts on the article that first used the term “Lean.”
See on www.leanblog.org


Sep 26 2013
Cells in Jewelry Manufacturing? | Dumontis
See on Scoop.it – lean manufacturing
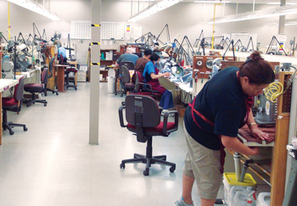
The words in the article are great, but the picture does not match. This looks like traditional workbench manufacturing, not Lean cells!
As Crocodile Dundee would have said, that‘s not a cell, this is a cell:
This one is in machining. For assembly, I don’t have as good a video, but this is picture of an assembly cell for small parts:
See on www.mjsa.org
Share this:
Like this:
By Michel Baudin • Press clippings 0 • Tags: Cells, Jewelry, Lean