Feb 8 2012
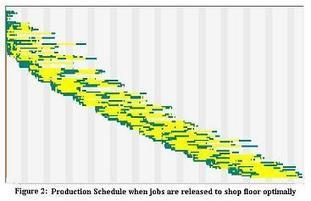
Graphic representation of a Lean schedule
Via Scoop.it – lean manufacturing
A clever graphic tool. According to the author, Prasad Velaga, the schedule was actually generated by finite capacity scheduling logic from a real test dataset that was taken from a job shop.
Via optisol.biz


Feb 16 2012
Safety Stocks: Beware of Formulas
A formula you find in a book or learn in school is always tempting. It is a “standard.” If you follow it, others are less likely to challenge your results. These results, however, may be worthless unless you take a few precautions. Following are a few guidelines:
The safety stock formula for the reorder point method
Safety stock is a case in point. The literature gives you a formula that is supposed to allow you to set up reorder point loops with just the minimum amount of safety needed to prevent shortages under certain conditions of variability in both your consumption rate and your replenishment lead time. It is a beautiful application of 19th century mathematics but I have never seen it successfully used in manufacturing.
Let us look more closely at what it is so you can judge whether you would want to rely on it. Figure 1 shows you a model of the stock over time when you use the Reorder Point method and both consumption and replenishment lead time vary according to a normal distribution. The amount in stock when the reorder point is crossed should be just sufficient to cover your needs until the replenishment arrives. But since both replenishment lead time and demand vary, you need some safety stock to protect against shortages.
Figure 1. The reorder point inventory model
If your demand is the sum of small quantities from a large number of agents, such as sugar purchases by retail customers in a supermarket, then the demand model makes sense. In a manufacturing context, there are many situations in which it doesn’t. If you produce in batches, then the demand for a component item will be lumpy: it will be either the quantity required for a batch or nothing. If you use heijunka, it will be so close to constant that you don’t need to worry about its variations.
What about replenishment lead times? If in-plant transportation is by forklifts dispatched like taxis, replenishment lead times cannot be consistent. On the other hand, if it takes the form of periodic milk runs, then replenishment lead times are fixed at the milk run period or small multiples of it. With external suppliers, the replenishment lead times are much longer, and cannot be controlled as tightly as within the plant, and a safety stock is usually needed.
Let us assume that all the conditions shown in Figure 1 are met. Then there is a formula for calculating safety stock that you can find on Wikipedia or in David Simchi-Levy’s Designing and Managing the Supply Chain (pp. 53-54). Remember that it is only valid for the Reorder Point method and that it is based on standard deviations of demand and lead time that are not accessible for future operations and rarely easy to estimate on past operations. The formula is as follows:
C = NORMSINV(Service level)
Case study: Misapplication of the safety stock formula
This formula is occasionally discussed in Manufacturing or Supply Chain Management discussion groups, but I have only ever seen one attempt to use it, and it was a failure. It was for the supply of components to a factory, and 14 monthly values were available for demand, but only an average for lead times.
The first problem was the distribution of the demand, for which 14 monthly values were available. This is too few for a histogram, but you could plot their cumulative distribution and compare it with that of a normal distribution with the same mean and standard deviation, as in Figure 2. You can tell visually that the actual distribution is much more concentrated in the center than the normal model, which is anything but an obvious fit. Ignoring such objections, the analyst proceeded to generate a spreadsheet.
Figure 2. Actual versus normal cumulative distribution
The second problem is that he entered the formula incorrectly, which was not easy to see, because of the way it was written in Excel. The formula in the spreadsheet was as follows:
C*SQRT((AJ4*AL4^2)+(AI4^2*AM4^2))
then, looking at the spreadsheet columns, you found that they were used as follows:
And therefore the first term under the square root sign was σDxμL2 instead of μLxσD2.
The third problem was that the formula requires estimates of standard deviations for both consumption and replenishment lead times, but no data was available on the latter. To make the formula produce numbers, the standard deviations of replenishment lead times was arbitrarily assumed to be 20% of the average.
For all of these reasons, the calculated safety stock values made no sense, but nobody noticed. They caused no shortage, and the “scientific” formula proved that they were the minimum prudent level to maintain.
Sizing safety stocks in practice
There is no universal formula to determine an optimal size of safety stocks. What can often be done is to simulate the operation of a particular replenishment loop under specified rules. For a simulation of a Kanban loop using Excel, see Lean Logistics, pp. 208-213.
No calculation or simulation, however, is a substitute for keeping an eye on what actually happens on the shop floor during production. One approach is to separate the safety stock physically from the regular, operational stock and monitor how often you have to dig into it. If, say, six months go by without you ever needing it, you are probably keeping too much and you cut it in half. With a Kanban loop, you tentatively remove a card from circulation. If no shortage results, then the card was unnecessary. If a shortage occurs, you return the card and look for an opportunity to improve the process so that the card can be removed.
Share this:
Like this:
By Michel Baudin • Technology 38 • Tags: Kanban, Logistics, Reorder point, Visual management