Jul 18 2022
The Most Basic Problem in Quality
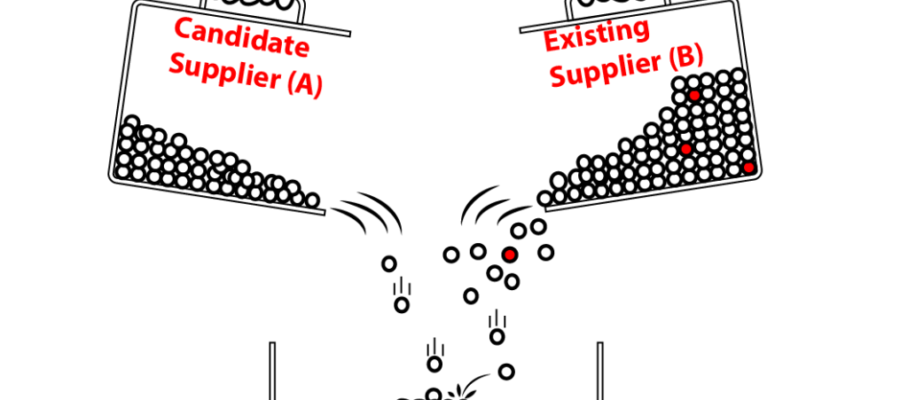
Two groups of parts are supposed to be identical in quality: they have the same item number and are made to the same specs, at different times in the same production lines, at the same time in different lines, or by different suppliers.
One group may be larger than the other, and both may contain defectives. Is the difference in fraction defectives between the two groups a fluctuation or does it have a cause you need to investigate? It’s as basic a question as it gets, but it’s a real problem, with solutions that aren’t quite as obvious as one might expect. We review several methods that have evolved over the years with information technology.


Nov 7 2022
Analyzing Variation with Histograms, KDE, and the Bootstrap
Assume you have a dataset that is a clean sample of a measured variable. It could be a critical dimension of a product, delivery lead times from a supplier, or environmental characteristics like temperature and humidity. How do you make it talk about the variable’s distribution? This post explores this challenge in the simple case of 1-dimensional data. I have used methods from histograms to KDE and the Bootstrap, varying in vintage from the 1890s to the 1980s:
Other methods were surely invented for the same purpose between 1895 and 1960 or since 1979, that I don’t know about or haven’t used. Readers are welcome to point them out.
The ones discussed here are not black boxes, automatically producing answers from a stream of data. All require a human to tune the settings of the tools. And this human needs to know the back story of the data.
Contents
Share this:
Like this:
By Michel Baudin • Data science 2 • Tags: Histogram, KDE, Kernel Density Estimator, Process capability