Dec 22 2022
Introduction to Manufacturing — First Print Copies
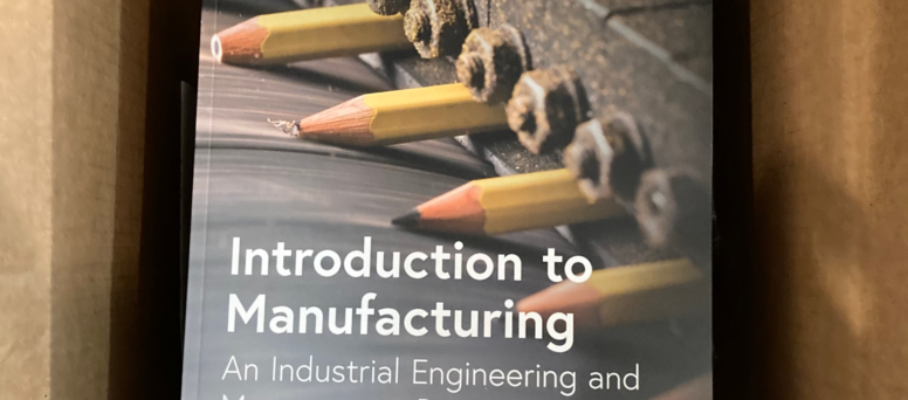
As co-author of Introduction to Manufacturing, I received the first print copies with trepidation::
- Did they print it on good paper?
- Does the book stay open flat without paperweights on each side?
- Are all the numbers and cross-references accurate?
- Are the pictures sharp and the colors vivid?
- …
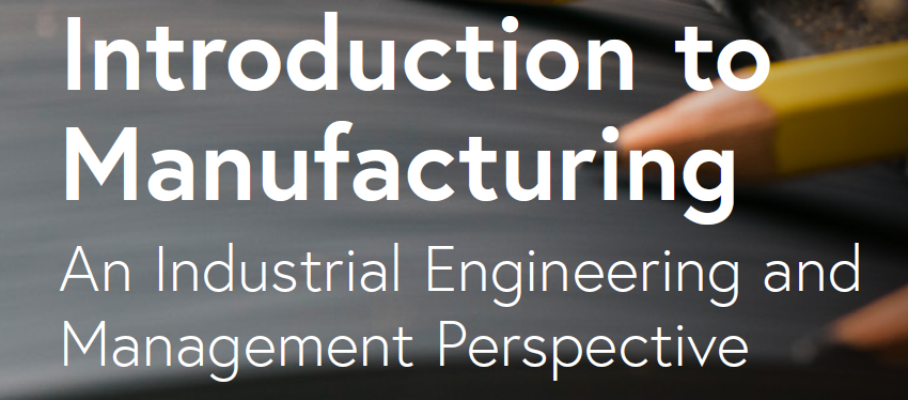
For the paperback edition, so far, it’s yes on all counts. Here is a sample of a page spread:

The only elements I found missing are three endorsements of Introduction to Manufacturing that we greatly appreciate:
- “This superb book explains how to design, manage, and improve manufacturing operations. Based on their deep expertise, Baudin and Netland compellingly present a great resource of manufacturing knowledge – useful for both novices and experts.“ – – Charles H. Fine, Chrysler LGO Professor of Management, MIT Sloan School of Management
- “Baudin and Netland’s comprehensive text serves as an important and timely reminder that manufacturing remains as important in a world of ubiquitous digitalization, as it ever has been.“ – Matthias Holweg, Professor and American Standard Companies Chair of Operations Management, Saïd Business School, University of Oxford.
- “This is the first book of its kind, situated at the nexus of manufacturing, industrial engineering, and management – precisely what students and organizations need.“ – Adedeji Badiru, Professor and Dean of Graduate School of Engineering and Management, Air Force Institute of Technology.
We hope to see them in the next print run.
#introductiontomanufacturing, #manufacturing


Sep 10 2023
Presenting at the AIM Conference in Groningen
The European Academy for Industrial Management (AIM) invited co-author Torbjørn Netland and me to speak at their 45th annual conference in Groningen, NL, about what students should learn in Industrial Engineering and Management and how they should learn it. AIM is a society of academics in the field, and they had a keen interest in our Introduction to Manufacturing.
This was the opportunity for me to present our concept of Industrial Engineering as the engineering of human work and for Torbjørn to describe innovations in teaching methods that were accelerated by the COVID-19 pandemic, particularly in the use of video materials in flipped classrooms and the application of AI in interactions with students.
Continue reading…
Share this:
Like this:
By Michel Baudin • News • 2 • Tags: IE, industrial engineering, Industrial Management