Dec 1 2022
About Digital Twins
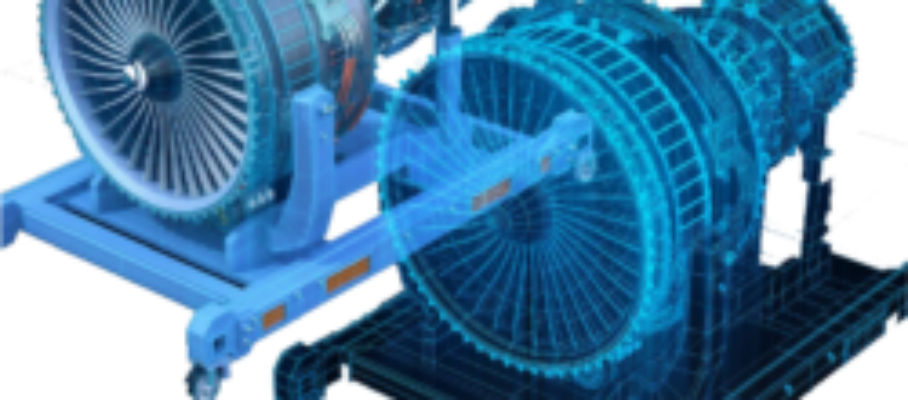
Some hosts showed digital twins during the Van of Nerds tour de France last September, but none mentioned the cyber-physical systems touted as a key component in Industry 4.0. Furthermore, we also found that the meaning of digital twin had drifted away from detailed simulations of physics and chemistry as part of a cyber-physical system for process control.
Instead, a digital twin is now an animation of part movements and machine status in a line for production control. This has effectively disabled discussions of digital twins in the context of cyber-physical systems, which matters in stabilizing and establishing capability for high-technology processes like additive manufacturing.


Nov 13 2023
Process Capability Indices
Within the quality profession, a capable process is one with a high C_{p_k}. In the field, it is not quite so simple. My colleague Joerg Muenzing recently shared concerns about the process capability indices:
Let’s take a closer look.
Continue reading…
Share this:
Like this:
By Michel Baudin • Data science • 7 • Tags: capability index, Cp, Cpk, Process capability, Quality