May 9 2013
Lean dairy farming in New Zealand | The Southland Times
See on Scoop.it – lean manufacturing
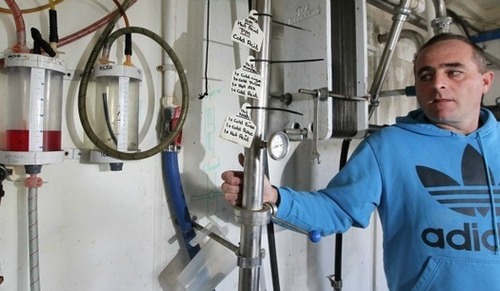
“Southland’s dairy farms and economy could reap the benefits of a manufacturing programme designed to increase efficiency in the industry.
The Venture Southland-led Lean Manufacturing Programme focuses on enhancing on-farm performance, reducing input costs and developing the skills and knowledge of farmers by identifying areas where efficiency gains can be made.”
Michel Baudin‘s insight:
Based on the article, it boils down to 5S.
See on i.stuff.co.nz


May 10 2013
Lean in the Australian bottle cap industry | Foodmagazine
See on Scoop.it – lean manufacturing
 “What are the key factors necessary for organisations in the caps and closures industry to successfully drive a lean management initiative? And how can it ensure success and accelerate progress?
The key is to ensure that before program start-up, the organisation’s leaders buy-in to the fact that their lean management program must be viewed from a whole-of-business perspective.”
If you have been wondering about the specifics of Lean in the Australian bottle cap industry, the article will disappoint you.
It is a generic discussion about management, strategy, training, and metrics, with arguable points that could be made about any business, from car making to slaughtering pigs and selling insurance. All you would need to do is change the title and the picture.
Without setting foot in an bottle cap plant in Australia, however, it is not difficult to imagine some of the specific challenges the industry faces, like a market of only 23 million consumers spread over an area almost as large as the US.
Given that resin pellets and pigments are less bulky than caps, they are easier to truck around and you might wonder whether this leads the industry to set up many small plants near customers rather than a few large plants.
You might also wonder whether they are delivered to customers as heaps in bins or in sleeves with a controlled orientiation for easy feeding into capping machines…
These are just a few of the questions the article does NOT answer. So why clip it? To successfully implement Lean in a new industry, you need these answers and many others about its management and its technology.
Then you need to work with managers and engineers to not only copy approaches and tools from other indusries, but also adapt them and invent new ones as needed. The article’s authors may have done this, but it is not what they are sharing.
See on www.foodmag.com.au
Share this:
Like this:
By Michel Baudin • Press clippings 0 • Tags: Food industry, Lean management