Aug 7 2013
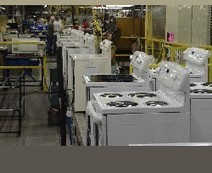
GE Appliance Plant Survival Credited to Lean | Chattanooga Times Free Press
See on Scoop.it – lean manufacturing
See on timesfreepress.com
Aug 7 2013
See on Scoop.it – lean manufacturing
See on timesfreepress.com
Aug 6 2013
See on Scoop.it – lean manufacturing
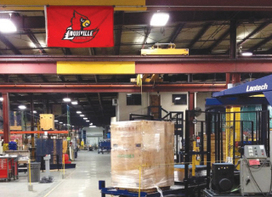
What sets Lantech apart from the competition is the fact that its employees are spending 30 to 40 percent of their creative energy problems solving, says Lancaster, and the rest of their energy is spent on making Lantech’s products better — safer, higher quality, lower cost, quicker. “They go home feeling like they really made a difference, rather than go home frustrated that they had to use all their energy to solve the same problem today that they did last week.”
See on www.mbtmag.com
Aug 1 2013
See on Scoop.it – lean manufacturing

Renaud Anjoran shares his experience of mistake-proofing in Chinese factories, and quotes “Lean Assembly.” Thanks.
See on www.qualityinspection.org
Jul 29 2013
See on Scoop.it – lean manufacturing
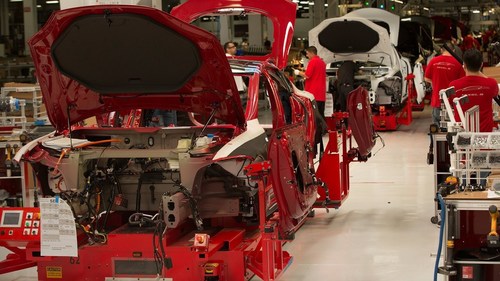
If founder Elon Musk is right, Tesla Motors just might reinvent the American auto industry—with specialized robots building slick electric cars in a factory …
Tesla just released this promotional video showing glimpses of its factory, the former NUMMI plant in Fremont, CA. Tesla is partialy owned by Toyota.
See on www.youtube.com
Aug 9 2013
What Can We Learn from NIST’s Next Generation Manufacturing Studies?
When you hear anyone say “Studies show…”, you want to know who studied what and how, so that you can use what Kaiser Fung calls your number sense to decide what, if anything, can be learned.
Since 2008, “Next Generation Manufacturing Studies” have been conducted in the US by the following:
Results are available on line up to 2011, and the 2013 study is underway. It is intended to evaluate “awareness, best practices, and achievements” in the following six areas:
By what methods are these studies conducted? The following is p.27 from the 2011 National Executive Summary:
This study is therefore entirely based on questionnaires filled out by a small, self-selected sample of companies rating themselves on a scale of 1 to 5 on issues like “the importance of customer-focused innovation.” It involves no site visit or personal interviews. The responses were only “cleansed to ensure answers were plausible,” a statement that leaves much to the imagination.
This raises the following questions:
Share this:
Like this:
By Michel Baudin • Management 0 • Tags: Data mining, next-generation manufacturing, NGM, NIST