Michel Baudin's Blog
Ideas from manufacturing operations
  • Home
  • Home
  • About the author
  • Ask a question
  • Consulting
  • Courses
  • Leanix™ games
  • Sponsors
  • Meetup group

Jul 18 2013

The Meaning of “Total” in Japanese Improvement Programs

As Armand Feigenbaum originally formulated Total Quality Control (TQC) in 1951, it meant quality control from product design to after-sales service. It had to do with the scope of the activity, not with who participates. In 1984, when Kaoru Ishikawa described the Japanese version of TQC, “Total” had come to mean “company-wide” (全社的,  zenshateki). Sometimes, it is even explicitly stated to mean “with participation by everyone” (全員参加, zenyinsanka).

It can be argued that the Japanese side mistranslated “Total,” but it makes no difference. If we want to understand TQC or TPM, we need to go by what they mean by it and realize its implications. “Participation by everyone,” in particular, means the following:

  1. The CEO and the janitor both participate. Personal involvement by top management is essential because it prevents anybody else claiming they are too busy.
  2. Training in the activity must cascade down from top management through all the layers in all the departments.
  3. There must be sanctions for refusal to participate.

As a consequence, the “Total” programs are difficult and expensive to implement. Before starting one, you must be sure that:

  1. It is worth it.
  2. The workforce has the needed skills.
  3.  Management relations are conducive to success.

Otherwise, it most often fizzles out after a flurry of initial activity. In the worst case, it leads to a mutiny. When starting improvement in a manufacturing plant, the prerequisites for any kind of “Total” program are rarely met. It is safer to start a with activities involving local, small teams of volunteers, whose success motivates others to join in. This gradually strengthens the organization to the point where it is able to pull through a program that requires participation by everyone.

Share this:

  • Click to print (Opens in new window) Print
  • Click to share on Facebook (Opens in new window) Facebook
  • Click to share on LinkedIn (Opens in new window) LinkedIn
  • Click to share on Reddit (Opens in new window) Reddit
  • Click to share on X (Opens in new window) X
  • Click to email a link to a friend (Opens in new window) Email

Like this:

Like Loading...

By Michel Baudin • Management • 1 • Tags: Lean implementation, TPM, TQC

Jul 15 2013

Life after NUMMI and Solyndra for Fremont, CA | Manufacturers’ Monthly

See on Scoop.it – lean manufacturing
“How Fremont is turning itself into a magnet for manufacturers Manufacturers’ Monthly “The Warm Springs District has a centralised location, vast and unoccupied land, accessibility to BART [Bay Area Rapid Transit system] and a world-class…”


Michel Baudin‘s insight:

While Fremont, CA, is not well known outside the San Francisco Bay Area, it has a place in history as the site of the first auto plant in the US to fully apply the Toyota Production System, 5 years before it was called “Lean.” It was the NUMMI jjoint venture between GM and Toyota. It resurrected a shuttered GM plant in 1984, rehiring 2,500 of its former workers, and successfully built cars for both owners for 26 years until the GM bankruptcy forced its closure in 2010, causing the direct loss of nearly 5,000 jobs, not including the losses in the network of suppliers that had grown around the plant. Solar cell panel maker Solyndra was then a short-lived hope for revival in Fremont, until it went bankrupt in 2011.

Tesla now produces cars in part of the old NUMMI plant, giving it a 3rd lease on life, and disk-drive maker Seagate is moving into the old Solyndra facility. According to this article, Fremont is now marketing itself as a hub for high-technology manufacturing.

I live across the Bay from Fremont, and root for its success.

See on www.manmonthly.com.au

Share this:

  • Click to print (Opens in new window) Print
  • Click to share on Facebook (Opens in new window) Facebook
  • Click to share on LinkedIn (Opens in new window) LinkedIn
  • Click to share on Reddit (Opens in new window) Reddit
  • Click to share on X (Opens in new window) X
  • Click to email a link to a friend (Opens in new window) Email

Like this:

Like Loading...

By Michel Baudin • Press clippings • 0 • Tags: Fremont, Lean, NUMMI, Solyndra, Toyota, TPS

Jul 14 2013

Lean Manufacturing @ Atlas Copco

See on Scoop.it – lean manufacturing

The new GA VSD+ compressor from Atlas Copco is manufactured on a lean production line. www.atlascopco.com/GAVSDplus

See on www.youtube.com

Share this:

  • Click to print (Opens in new window) Print
  • Click to share on Facebook (Opens in new window) Facebook
  • Click to share on LinkedIn (Opens in new window) LinkedIn
  • Click to share on Reddit (Opens in new window) Reddit
  • Click to share on X (Opens in new window) X
  • Click to email a link to a friend (Opens in new window) Email

Like this:

Like Loading...

By Michel Baudin • Press clippings • 1 • Tags: Lean implementation, Lean manufacturing

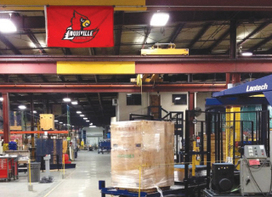
5S example from Korry

Jul 9 2013

Visual management as a “tier 2” tool

In the TPS Principles and Practice discussion group on LinkedIn, Emmanuel Jallas asked whether visual management was a “lever to make other tools work, or  a tool by itself.”

  • Visual management as embedded into other tools
  • Visual management and Potemkin villages
  • Visual versus verbal communication
  • Visual management as part of the information system
  • Japanese terms for visible management

Visual management as embedded into other tools

As I see it, visual management should be part of everything else we do, but not treated as a stand-alone topic. Visual management should be considered in the design of a plant, a production line, a supermarket, a shipping/receiving area, a crossdock, a cafeteria, a restroom, etc. It is part of setup time reduction, cell design, or kanban implementation. It make visual management a “tier 2” tool.

If, however, you try to discuss it or teach it as a stand-alone, generic subject, you quickly get dragged into what it involves in different, specific contexts. If you have a mixed group, whatever you say will only be of interest to a minority at a time. On the other hand, if you are teaching Lean Logistics, then the discussion of visual management in materials handling comes naturally.

If you write a “How to” guide, you really have to think who your intended readers are. If you write on how to design a machining cell, you know exactly who they are. And, if you do a good job of writing it, all of it will be of use to this audience.

But who is the audience for visual management? It’s everybody! But the general theory of visual management fits in a few pages. After that, you have to go to examples, and each example is for an application that is only of interest to a tiny sliver of a manufacturing organization. So maybe 1% of your How-to book is of interest to each reader, but you can’t cut any of it, because another reader’s 1% is somewhere in the  remaining 99%.

By the way, people like Gwendolyn Galsworth or Michel Greif, who have written several books on visual management obviously disagree with me on this. I use their books like dictionaries, not how-to guides.

Visual management and Potemkin villages

Since visual management is, … visible, it is commonly part of the Potemkin villages put up by companies that want to look lean to outsiders. But the fakery is easy to spot when, for example, you see bins under a sign that says the area should be clear, the operators don’t know what the colors on the andon lights mean, the color codes are inconsistent across the floor, or a production monitor shows overproduction and production continues,… It does not take many discrepancies to torpedo the credibility of visual management.

Complicated color codes are a tell-tale sign that a system is not used.  The andon lights I have seen in Japan have only three colors with one and only one solidly lit at a time. It’s Red, Yellow, and Green, with Red meaning that the machine is stopped, Yellow that it is available, and Green that it is working. Used consistently throughout a shop floor, it gives you an overall equipment status at a glance.

Of course, the light suppliers prefer to sell more elaborate models, but I have never met an operator who could tell me what White with blinking Blue was supposed to mean, especially when it was not consistent across machines. So, if you see that, you know that the lights are just there for decoration.

Visual versus verbal communication

Reliance on words is not recommended for an audience that does not have a common language. That is why traffic signs in Europe are mostly wordless and European car dashboards are covered with pictograms, that are sometimes but not always self-explanatory, which is why I have taken to calling them “euroglyphs.”

An American car dashboard with words is actually easier to understand, but only if you know English. Like European roads, a California production shop floor may have a work force with multiple nationalities and uneven English proficiency. As a consequence, using words for instructions or safety warnings is not much of an option.

Two resources I find helpful is thinking through these issues are usability engineering experts Don Norman, author of The Design of Everyday Things, and Asaf Degani, author of Taming Hal.

If you include hearing, touch and smell, I suppose it should be called “sensory management” rather than “visual management.” If we use “visual management” for all forms of sensory management, what term are we going to use for what is specifically visual?

Visual management as part of the information system

The term “information system” should encompass all the means used in a plant to exchange and process information. Visible management is part of it, along all the computer applications, from CNCs, PLCs and SCADA systems to corporate servers for technical and business data. They are all components of the same information system and both are needed to run a plant.

Japanese terms for visible management

The Japanese term I have heard for visual management is ”medemirukanri”(目で見る管理), literally “management you can see with your eyes.” Mieruka (見える化) is new to me; it means “transformation into something visible.” I see it as an improvement, as it is shorter and just as self-explanatory. I suppose you could say that medemirukanri is the result you achieve and mieruka the process by which you achieve it, but I don’t see that nuance in the usage.

Share this:

  • Click to print (Opens in new window) Print
  • Click to share on Facebook (Opens in new window) Facebook
  • Click to share on LinkedIn (Opens in new window) LinkedIn
  • Click to share on Reddit (Opens in new window) Reddit
  • Click to share on X (Opens in new window) X
  • Click to email a link to a friend (Opens in new window) Email

Like this:

Like Loading...

By Michel Baudin • Technology • 5 • Tags: Lean, Potemkin village, Visual management

Jul 9 2013

Betting on Lean, or …. Analytics versus Empowerment | Bill Waddell

See on Scoop.it – lean manufacturing

“Management is all about playing the odds. […]  In operations, calculate lot sizes, generate forecasts and set quality standards with enough data and increasingly sophisticated algorithms and statistical methods and you will increase the chances of coming close enough.  At least that is the theory, and the hope.

This is the basic premise of big data and ERP.  With point of sale scanning, RFID, smart phones and all of the other data collecting technologies increasingly in use, the data to feed the engines is more and more available.  The potential and the lure of the data driven, analytical approach to finding the center line and getting more decisions closer to correctness is growing.

The other approach is empowered people.  Recognizing that management cannot be involved in every one of the individual customer interactions and operational, situational, tiny decisions, those calls are left to the people on the spot.  They are expected to rely on their knowledge, understanding of company values and goals, and the information available to them in very real time to decide what to do.[…] The basic question is whether empowered people will get it right more often than big computer.”

Michel Baudin‘s insight:

In this article, Bill Waddell presents the data-driven approach to management decision making as contradictory to people empowerment. I do not see these as mutually exclusive.

In 1993, there was a group within Toyota’s logistics organization in the US that, based on weather data, thought that the Mississippi might flood the railroad routes used to ship parts from the Midwest to the NUMMI plant in California. Four days before the flood, they reserved all the trucking available in the Chicago area, for the daily cost of 6 minutes of production at NUMMI. When the flood hit, they were able to ship the parts by truck around the flood zone, and NUMMI didn’t miss a beat.

This is what a good data scientist  does.

In Numbersense, Kaiser Fung points out that data analysis isn’t just about the data, but also about the assumptions people make about it. As an example, he points out the Republican polling fiasco of the 2012 election, as being due to the combination of flawed data collection and equally flawed modeling.

In other words, it’s not a computer that comes up with answers from data, but a human being, and the quality of these answers depends as much on the human analyst’s understanding of the underlying reality as it does on the ability to collect clicks from the web or transactions from point-of-sale systems.

Good data analysis does not require petabytes of data. In statistics, a small sample is 10 points; a large sample, 100 points. The difference matters because, with small samples, there are many convenient approximations that you cannot make. But 100 points is plenty for these approximations to work.

With millions of points, the tiniest wiggle in your data will show overwhelming significance in any statistical test, which means that these test are not much use in that context. To figure out what this tiny wiggle is telling you about reality, however, you still need to understand the world the data is coming from.

I don’t see an opposition between relying on people and relying on data, because, whether you realize it or not, you are never relying on data, only on people’s ability to make sense of it.

See on www.idatix.com

Share this:

  • Click to print (Opens in new window) Print
  • Click to share on Facebook (Opens in new window) Facebook
  • Click to share on LinkedIn (Opens in new window) LinkedIn
  • Click to share on Reddit (Opens in new window) Reddit
  • Click to share on X (Opens in new window) X
  • Click to email a link to a friend (Opens in new window) Email

Like this:

Like Loading...

By Michel Baudin • Blog clippings • 0 • Tags: analytics, big data, data science, empowerment, Lean, statistics

Jul 6 2013

A Tour of Canon’s Suzhou facility | WhatTheyThink | Eric Vessels

See on Scoop.it – lean manufacturing

In addition to the Tokyo headquarters visit I wrote about Friday, analysts and editors were also invited to Shanghai before leaving Asia to attend a plant tour of Canon’s Suzhou facility.  The facility is located in the Jiangsu province, an hour and a half bus ride west of Shanghai.

See on whattheythink.com

Share this:

  • Click to print (Opens in new window) Print
  • Click to share on Facebook (Opens in new window) Facebook
  • Click to share on LinkedIn (Opens in new window) LinkedIn
  • Click to share on Reddit (Opens in new window) Reddit
  • Click to share on X (Opens in new window) X
  • Click to email a link to a friend (Opens in new window) Email

Like this:

Like Loading...

By Michel Baudin • Press clippings • 0 • Tags: Asia, Canon, cell, Cellular manufacturing, China, Jiangsu, Shanghai

«< 87 88 89 90 91 >»

Follow Blog via Email

Enter your email address to follow this blog and receive notifications of new posts by email.

Join 585 other subscribers

Recent Posts

  • How One-Piece Flow Improves Quality
  • Using Regression to Improve Quality | Part III — Validating Models
  • Rebuilding Manufacturing in France | Radu Demetrescoux
  • Using Regression to Improve Quality | Part II – Fitting Models
  • Using Regression to Improve Quality | Part I – What for?

Categories

  • Announcements
  • Answers to reader questions
  • Asenta selection
  • Automation
  • Blog clippings
  • Blog reviews
  • Book reviews
  • Case studies
  • Data science
  • Deming
  • Events
  • History
  • Information Technology
  • Laws of nature
  • Management
  • Metrics
  • News
  • Organization structure
  • Personal communications
  • Policies
  • Polls
  • Press clippings
  • Quality
  • Technology
  • Tools
  • Training
  • Uncategorized
  • Van of Nerds
  • Web scrapings

Social links

  • Twitter
  • Facebook
  • Google+
  • LinkedIn

My tags

5S Automation Autonomation Cellular manufacturing Continuous improvement data science Deming ERP Ford Government Health care industrial engineering Industry 4.0 Information technology IT jidoka Kaizen Kanban Lean Lean assembly Lean Health Care Lean implementation Lean Logistics Lean management Lean manufacturing Logistics Management Manufacturing Manufacturing engineering Metrics Mistake-Proofing Poka-Yoke Quality Six Sigma SMED SPC Standard Work Strategy Supply Chain Management Takt time Toyota Toyota Production System TPS Training VSM

↑

© Michel Baudin's Blog 2025
Powered by WordPress • Themify WordPress Themes
%d