
Sep 10 2023
Presenting at the AIM Conference in Groningen
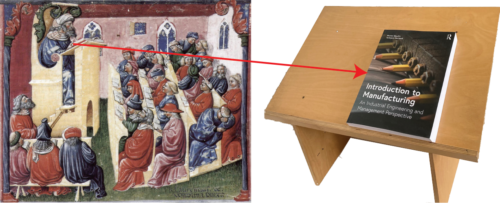
The European Academy for Industrial Management (AIM) invited co-author Torbjørn Netland and me to speak at their 45th annual conference in Groningen, NL, about what students should learn in Industrial Engineering and Management and how they should learn it. AIM is a society of academics in the field, and they had a keen interest in our Introduction to Manufacturing.
This was the opportunity for me to present our concept of Industrial Engineering as the engineering of human work and for Torbjørn to describe innovations in teaching methods that were accelerated by the COVID-19 pandemic, particularly in the use of video materials in flipped classrooms and the application of AI in interactions with students.


Sep 13 2023
HR: The elephant in the room for psychological safety
In his latest column in Quality Digest, Mark Graban wrote the following about psychological safety:
“How do leaders cultivate the conditions in which employees feel safe enough to speak up and participate in continuous improvement? Clark argues that leaders need to: 1) model vulnerable acts; and 2) reward vulnerable acts.
For example, leaders must model the key behaviors they want to see, such as admitting that things aren’t perfect. Leaders can also model helpful behaviors by sharing an idea along with the words, “I might not be completely right, so let’s test our idea on a small scale and see.” When leaders model these vulnerable acts, some employees might choose to follow their lead.
When a person chooses to speak up, it isn’t a matter of courage or character; it’s a function of culture. The level of safety that’s felt by an employee is the end result of all of the interactions they’ve had with leaders and colleagues, past and present.”
Source: Graban, M. (2023) Stop Spending Money on Problem-Solving Training, Focus on Psychological Safety Instead Quality Digest
Share this:
Like this:
By Michel Baudin • Press clippings 5 • Tags: Human Resources, Psychological Safety