Jun 28 2014
40 Years on, the Barcode Has Turned Everything Into Information | Wired
“Without the barcode, FedEx couldn’t guarantee overnight delivery. The just-in-time supply chain logistics that allow Walmart to keep prices low would not exist, and neither would big-box stores. Toyota’s revolutionary kanban manufacturing system depends on barcodes. From boarding passes to hospital patients, rental cars to nuclear waste, barcodes have reduced friction like few other technologies in the world’s slide toward globalization.”
Source: www.wired.com
While this article exaggerates a bit, the fact is that the bar code is the first successful auto-ID technology, so successful in fact that more advanced technologies, like RFID or even QR-codes, have yet to displace it. There are barcodes on Kanbans, but you really cannot say that the system depends on them, because Kanbans were used early on without barcodes more than two decades.
The 40th anniversary of the barcode is an opportunity to remember, or learn, who invented it and why. This article does not credit the actual inventors, Norman Woodland and Bernard Silver, who patented it in 1952, but only supermarket executive Alan Haberman, who made its use practical to improve inventory tracking and speed up checkout. In 1974 he led an industry committee to adopt the barcode as a vehicle to implement a Universal Product Code or UPC. It is as much the story of the emergence of a standard as a story of technology.
In Manufacturing, barcodes are used almost everywhere to identify warehouse locations and stock keeping units, to validate picks, and to track component serial numbers. While celebrating the success and the usefulness of this technology, we should, however, remain aware of its limitations. Even in supermarkets, barcode reading remains a largely manual process. A human still has to wave around small items in front of a reader, or a reading gun in front of large items, and it often takes multiple attempts before you hear the beep confirming a successful read.
Fully automatic barcode reading is occasionally found in manufacturing operations where the environment is clean, with good lighting, high contrast, and a controlled orientation. QR codes are less demanding. They can be, for example, etched on the surface of a metal workpiece, and read inside the work enclosure of a machine-tool.
RFID tags hold the promise of full automatic reading at a distance. It has made them successful in public transportation passes like the Octopus card in Hong Kong or the Navigo card in Paris, as well as in electronic toll collection in the Fastrak system in California.
Barcodes are also limited to IDs and cannot be updated. As a consequence, they have to be used in the context of an information system that contains all the data keyed on the ID, which can be “the cloud” in a supply chain, or a local manufacturing execution system in a factory. By contrast, a high-end RFID tag can locally contain the entire bill of materials of a product moving down an assembly line, its current location in the process, and any measurements that may have been made on it at earlier operations. For a finished product, it can contain the entire maintenance history of a unit.


Aug 5 2014
How to Really See What is Going On in Your Workplace | IndustryWeek | Jamie Flinchbaugh
Source: www.industryweek.com
I don’t see data as necessarily dependent on assumptions. What assumptions are there behind, say, the number of boxes of Cereal Z you sold last month? It is just a fact. While photographs are a form of data, graphs and diagrams are ways of analyzing data and presenting results, which is also downstream from observation.
For the analysis of a plant, I see three main sources of input:
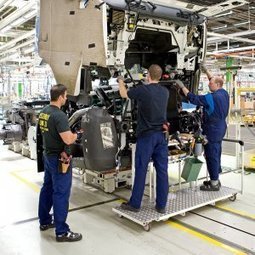
The Lean literature justifiably emphasizes direct observation. You go to where the work is being done, and then apply various mental techniques to help you notice relevant characteristics. You may even gather data in the form of photographs an videos for future analysis.
But it cannot be your only source. You also need to know what the manager’s ambitions are for the organization, what they have tried to realize them, and what obstacles they feel they have encountered. Their perceptions may or may not agree with what you see with your own eyes, but you need to know what they are.
Finally, any business activity leaves a data trail that should not be ignored, including product and process definitions, current status, history, and plans for the near and distant future. All of this also needs to be reviewed and confronted with direct observation and human perceptions.
It’s when you present your conclusions and recommendations that you use stories, graphs, diagrams, pictures, and videos to get your point across.
See on Scoop.it – lean manufacturing
Share this:
Like this:
By Michel Baudin • Press clippings 1 • Tags: analytics, Data analysis, Shop floor observation