Oct 30 2020
Who Uses Statistical Design Of Experiments In Manufacturing?
Next to SPC, Design of Experiments (DOE) is the most common topic in discussions of Statistical Quality. Outside of niches like semiconductors or pharmaceuticals, however, there is little evidence of use, particularly in production.
At many companies, management pays lip service to DOE and even pays for training in it. You must “Design experiments” if you pursue continuous improvement.
In manufacturing, DOE is intended to help engineers improve processes and design products. It is a rich but stable body of knowledge. The latest major innovation was Taguchi methods 40 years ago. Since then, Statistics has been subsumed under Data Science and new developments have shifted in emphasis from experimentation to Data Mining.
Experimentation in science and engineering predates DOE by centuries. Mastering DOE is a multi-year commitment that few manufacturing professionals have been willing to make. Furthermore, its effective use requires DOE know-how to be combined with domain knowledge.
Six Sigma originally attempted to train cadres of engineers called “Black Belts” in a subset to DOE. They then served as internal consultants to other engineers within electronics manufacturing. Six Sigma, however, soon lost this focus.
Contents
- Design of Experiments (DOE) versus Data Mining
- The Development of DOE
- Manufacturing Applications of DOE
- The Evolution of DOE
- DOE and Manufacturing Quality
- Statistics for Experimenters
- Screening and Response Surface Methodology (RSM)
- Conclusions
- For the Curious
- Software for DOE
Design of Experiments (DOE) versus Data Mining
From a data science perspective, what sets DOE apart from Data Mining is that you choose the observed variables and collect data specifically for the purpose of solving a problem. Data Mining, by contrast, is the retrieval of information from data already collected for a different purpose. In DOE, you plan every step from data collection to the presentation of results. You decide which variables to collect, by what means, in what quantities, how you will analyze the results, what thresholds will make you conclude one way or the other, and how you will justify your conclusions to stakeholders. Data Mining is like Forrest Gump’s box of chocolates, “you never know what you’re gonna get.”
Japanese academic Ichiji Minagawa made the same distinction in slightly different words:
“Design of experiments is a method for finding an optimum value fast from the smallest sample. The point is that there is no data. This is a big difference from multivariate analysis. Multivariate analysis is a method of finding valuable information from a pile of data. Design of experiments, on the other hand, is a technique used when there is no data.”
Datasets
Designed experiments yield high-quality data in quantities ranging from a few tens in small engineering problems to tens of thousands in the later phases of clinical trials for new drugs or A/B testing of web-page designs. Data mining is done on whatever data is already available. It can be millions of data points but their relevance and their quality need vetting.
Ronald Fisher was explicit in his focus on Small Data when he wrote:
“Only by tackling small sample problems on their merits […] did it seem possible to apply accurate tests to practical data.” Preface to Statistical Methods for Research Workers, 11th Edition (1950).
To draw inferences from small samples, you need thresholds to mark differences as “significant.” You test the observations against a null hypothesis, according to which there is a low probability that they should fall out of a given interval. You set this probability, or level of significance, arbitrarily set at 5%, 1%, 0.3%, or 3.4 ppm. The word “significant” means nothing unless you spell out the level.
The complexity associated with significance, however, vanishes with Big Data. With large datasets, the smallest perceptible wiggle in a statistic passes any significance test with flying colors. If a correlation coefficient calculated on 80 points is 0.2, it is insignificant even at the 5% level. If calculated on 10,000 points, the same correlation coefficient of 0.2 off-the-charts significant.
Technology
Until recently, technology limited opportunities. The most celebrated cases of early data mining include identifying the source of a cholera outbreak in London from locating patients and water pumps on a map in 1853, and estimating the production numbers of German tanks in World War II from the serial numbers of captured or destroyed tanks. Today, companies keep historical records and the web is a source of datasets to download or scrape.
To design experiments with paper, pencil, slide rules, and books of tables in the 1920s, Fisher used local people as human computers, like NASA’s Hidden Figures 30 years later. Today, any of us can do it with readily available software. The challenge has shifted from computing to understanding where the techniques apply and what the results say.
Maturity
As a consequence, the relative importance of DOE and Data Mining has shifted. It can be ascertained by mining the web for data about publications in both fields. As seen in the following table, the trick is to phrase the query fairly. “Statistical Design of Experiments” is more restrictive than “Design of Experiments” but also more precise:
| Source | Design of Experiments | Statistical Design of Experiments | Data Mining |
|---|---|---|---|
| Amazon Books | >6,000 | 321 | >20,000 |
| Google Books | 15.2M | 1.76M | 17.8M |
| Google Scholar | 6.55M | 4.85M | 3.75M |
The contrast between the queries is greater on Amazon than Google because Amazon catalogs what they are selling today while Google gives cumulative data. 321 titles on Amazon for “Statistical Design of Experiments” does not qualify the topic as active compared to Data Mining. The top DOE titles are mostly new editions or reprints of books that are decades old. For “Data Mining,” on the other hand, Amazon has more than 20,000 titles, including many published in the 2010s.
For a manufacturing professional in need of DOE, it means that it is, comparatively, a mature field. Its body of knowledge, while rich, does not change every 5 years.
The Development of DOE
DOE was developed in a context where experimentation already had a long history, and not for manufacturing in particular.
Experimentation in Science
As philosopher Michael Strevens writes about scientists “if they are to participate in the scientific enterprise, they must uncover or generate new evidence to argue with.” If you are a paleontologist, you uncover evidence in fossils; if a physicist, you generate it by experiments.

Experimentation is a key part of science but not all scientific experiments are statistically designed. Marie Curie and Nikola Tesla were successful experimenters before DOE existed. The first forms of DOE were invented in the 1920s by Ronald Fisher but, decades later, I met molecular biologists who had never heard of DOE and didn’t think they were missing out.
The biologists ran experiments based on their understanding of their science, and either the expected effect occurred or it didn’t. These experiments produced results that were binary and clear. Having run experiments for 450 years, physicists were not particularly receptive to statistical DOE.
DOE comes into play when results are not obvious but answers are needed. It originated in agricultural research where a fertilizer may enhance crop yield by 5% more than another but where such differences have tangible economic stakes. DOE is also used in social sciences and in marketing, where you don’t have the kind of mathematical models of physics.
Experimentation in Engineering
Experimentation is even more central to Engineering than to Science. This is because all engineers do is build artifacts, and experimentation is the only way to prove they work. The Wright Brothers ran experiments on lift in order to build an airplane that flew, not to understand fluid dynamics.
Engineers have to convince people other than their peers that their contraptions are safe and effective. For road vehicles, airplanes, rockets, or pharmaceuticals, market mechanisms and industry self-discipline have proven insufficient. Governments have had to step in and regulate.
In his summary of DOE for Manufacturing, Astakhov (2012) uses the following picture to explain the general context:

DOE aims to correlate the outputs \left(y_1,..., y_m\right) with inputs \left(x_1,..., x_n\right) in the presence of noise \left(z_1,..., z_p\right) and in the absence of a mathematical model of the System or Process. The experiment, or the sequence of experiments, lets you build an empirical one. It relates outputs to inputs without opening the black box. We still don’t know what happens inside but we have a model of its consequences.
In Astakhov’s discussion of DOE, the system is a black box: the experimenter has no knowledge of its inner workings. He makes it concrete with the following example:

Experimentation Based on Domain Knowledge Versus DOE
While the DOE model looks general, it doesn’t fit all the experiments scientists and engineers do. They often don’t start with a black box but with a generic model of the system and they experiment for the purpose of assigning specific values to model coefficients.
When the Wright brothers experimented with lift, they started from a model and used a wind tunnel to establish that it overestimated lift and measure more accurate values for a number of wing profiles.

Their experiment didn’t fit the DOE model because there was no black box. Sometimes, you treat the system as a black box even went you have a model of what happens in it, because all you care about is the relationship of outputs to inputs. The certification of drugs is a case in point.
Manufacturing Applications of DOE
Information about the applications of DOE in Manufacturing is not as easy to find as one might expect. For example, google “manufacturing + design-of-experiments”, you receive links to training courses and software packages but not use cases, preferably compiled by individuals or organizations that, like this author, have no skin in this game.
Readers with personal experience are invited to share it in comments. The point is to establish how effective DOE has been in Manufacturing for those who used it, not to estimate their numbers. It’s about whether it works, not how popular it is.
Pharmaceuticals
In pharmaceuticals, every new drug must undergo clinical trials based on protocols set by a government agency, that mandate specific forms of DOE. A chemist might have a better way but it doesn’t matter. A government agency needs to certify the drug before the company can sell it, and it may use up 7 out of the 20 years of the drug patent, after which competitors can produce generic versions. These agencies are the Food & Drug Administration (FDA) in the US and its counterparts in other countries.
This application is sufficiently important for a leading supplier of analytics software like SAS to have dedicated a product to it, JMP® Clinical.
Semiconductors
In semiconductors, process engineers use DOE because they need it in process development, not because of any external mandate. They can use whatever method they want as long as it works. While a technical challenge, it is faster and easier to demonstrate process capability in, say, plasma etching, than to convince the FDA that a new pain reliever is safe and effective.
It was not used in the early days of the industry. Bob Noyce did not use DOE to develop the integrated circuit (IC) and neither did Andy Grove to develop the processes used to this day to make ICs in high volumes. DOE penetrated the industry slowly, due to the cultural gap between process engineers and statisticians. In 1986, Six Sigma, as discussed below, was originally intended to spread DOE knowledge among electronics engineers at Motorola. The Six Sigma literature didn’t say so but the content of Six Sigma training did.
Cars
In manufacturing industries other than pharmaceuticals and semiconductors, it is difficult to find published cases of DOE that are not from software vendors or academics. The Minitab website, for example, has a case study of a team from Ford working with a supplier to remove brush marks on carpets while maintaining plushness.
It was, no doubt, a technical challenge but not quite as central to the car business as securing the approval of a new drug is to pharmaceuticals or developing the operations to build ICs on Silicon wafers to semiconductors. The car industry equivalent would have been eliminating leaks from transmissions or getting the electronics to run the same way in Death Valley in July and Minnesota in January.
Writing in the Harvard Business Review in 1990, Genichi Taguchi cites work on drive shafts at Mazda but say nothing about Toyota.
The Special Case of Toyota
While Toyota is known for experimentation in all aspects of its operations, it does not share much about DOE with the rest of the world. Given that DOE has been around for decades, if they were extensively using it, we would know by now, at least from Toyota alumni.
Japanese Consultants About DOE At Toyota
In Japan, the Research Center on Management Technology (経営技術研究所) is a consulting firm based in Nagoya whose members, while not Toyota alumni, have written many books about TPS, including one in 2008 about the Keywords for thoroughly implementing Quality Control within TPS.
They devoted 3 out 142 pages to DOE, with an example on spatter prevention in arc-welding, a process used for steel plates like axle housings. The experiment considers three factors — current, voltage, and waveform — and concludes that only current has an effect on the frequency of spattering. It is a simple case for DOE.
Toyota Alumni
Ian Low, an alumnus from Toyota in the UK, commented as follows on LinkedIn:
“My practical experience of this in Toyota was on honing of cylinder blocks for the sz (Yaris) engine. Setting up the honing heads was such a nightmare (utilizing air sizing) to first rough and then finish with the correct honing angle. We would quickly scrap 8-10 blocks every time we did a honing head change before we could get the process to stabilize on the +13 micron/-0 tolerance we needed.
Then along came the 2SZ variant (1.2 litre rather than 1.0 litre) and we had to reset the machine. I was convinced that following the lean principle of running in ratio (2:3) would totally sink our productivity as we’d be spending all our time changing heads and settings and making scrap.
And we did, for the first week. But the intense scrutiny the process came under drew us to look at all the tiny variables we’d never considered before and bring them into control. And I was proven wrong.
Things like ensuring honing fluid wasn’t getting into the air sizing system and resulting in faulty sizing readings. Things like very precisely controlling the pressure and cleanliness of the honing fluid. Basically it’s always a healthy exercise because you learn that things you assumed didn’t matter, actually did matter. I never experienced the use of any complex statistical approaches…”
Aeronautics
Boeing Frontiers has an article from 2003 about DOE that refers to an Applied Statistics group in the Phantom Works Mathematics and Computing Technology. Boeing’s Phantom Works still exists in 2020 as part of the defense group. Their website, however, makes no reference to DOE, except for the 2003 article.
The Evolution of DOE
Statistical Design of Experiments, as we know it, started with Ronald Fisher in the 1920s and, in Manufacturing, the state of the art is still largely the work of Genichi Taguchi, known in the US since the 1980s.
Fisher’s DOE and Crop Yields

Even though Fisher had been hired at the Rothamsted Agricultural Research Station for the task of mining a dataset accumulated over 70 years, he is best known as the father of Statistical DOE, based on experiments with crop yields.
When you treat the same crop with different fertilizers in different plots, you observe different yields. It doesn’t however, prove that one fertilizer works better than another. You work with small datasets because collecting data takes years. The differences you observe may be fluctuations or may be due to other factors that agricultural science cannot explain. Fisher, who was not an agronomist but a mathematician, developed methods for assessing the reality of these differences.
 In The Design of Experiments, Fisher (1935) presents his methods as generic and applicable to any experiment. Other than a tea tasting experiment, all the cases Fisher uses are about crop yields. About tea, the issue is whether one woman can tell from tasting whether the server added tea to milk or milk to tea. Chapter V is about assigning different fertilizer treatments to 36 plots in a 6×6 grid, using Fisher’s Latin Squares.
The following picture shows an arrangement of plots used at Rothamsted for wheat growing experiments since 1843:

The lesson from his book is not that there is a one-size-fits-all methodology for DOE. Instead, you tailor it to the needs of each domain.
From Crop Yields to Web Page Designs
Today, Google uses the simplest of Fisher’s techniques. They do A/B Testing on web page details that may be as small as the color of a confirmation button. You choose users to receive one version of the page or the other as if they were different fertilizers. Then you harvest the resulting crops of clicks. You don’t rely on any science of color preferences. You assume that the color of the button makes no difference, and analyze the data for evidence of the contrary.
From One to Multiple Factors
This kind of One-Factor-At-A-Time (OFAT) experiments are simple and easy to understand but often insufficient. You can use fertilizers in different doses, combine different ones, and irrigation patterns also play a role. In addition, crop size may not be the only output of interest. Quality matters too. And when there are interactions between factors, you cannot reach the best combination of levels by OFAT experiments. As data collection is time-consuming and expensive, you end up with small datasets for each combination of levels.
Legacy
The issues that Fisher addressed with Statistical DOE are still with us. We still use many of the tools he developed, particularly analysis of variance (ANOVA). Scientists and engineers, however, have not massively embraced his DOE.
DOE and Manufacturing Quality
When Fisher was pursuing the highest crop yields, he only cared about aggregate quantities for plots. Variations between individual plants within plots were not a concern. It’s different in manufacturing, where the goal is to produce identical units of the same item.
Critical Characteristics
The classical vision is to attach critical characteristics to an item. These are attributes or measurements with tolerances and you reject any unit missing attributes or with measurements outside of tolerance limits. Within this vision, the goal of process engineering and experimentation is for all units to pass.
It’s imperfect in that it is possible for a unit to have all the right characteristics at all operations and still not function properly at the end of the process. The designation of a characteristic as critical is a human judgment call. The engineers may not know which ones are truly critical, and may not have the means to observe them in-process without destroying the unit or slowing down production.
First Make It Precise, Then Accurate
Making a process capable means reducing the variability of its outputs. The idea is that, once you have the ability to precisely reproduce the output, you can adjust the aim to make it accurate. It is not always true, because the precision of the output may vary with the target you are aiming at.
Statistics for Experimenters
Statistics for Experimenters, 2nd Edition from 1978 by George E.P. Box, William G. Hunter, and J. Stuart Hunter shares the top position in the lists of Best Books about Design of Experiments with John Lawson’s 2014 Design and Analysis of Experiments with R
Math Versus Code
Statistics for Experimenters gives you mathematical formulas and results for examples and has an appendix of statistical tables. Design and Analysis of Experiments with R gives you software you can run — that is, if you know R. Fisher worked with human computers; Box, Hunter, and Hunter, with mainframes and punch cards; Lawson, with a connected laptop.
Applications to Manufacturing
Statistics for Experimenters expands the scope of DOE from Fisher’s crop yields to all sorts of other domains, including manufacturing processes. As Fisher described the Latin Square Design that is sometimes awkwardly abbreviated as “LSD,” it took imagination to envision this design applied outside of fertilizer studies. Box, Hunter, and Hunter did it, to fuel emissions from cars and yarn strength in synthetic fibers.
Their manufacturing examples, however, are like Fisher’s, about maximizing yields, not reducing variability in the output. Example 7.1, for example, is about maximizing the production volume of penicillin, not its consistency. Variation is studied in Chapter 17, in 33 pages out of a 653-page book.
Respect For Domain Expertise
Box, Hunter & Hunter also show respect for domain expertise. In the very beginning, they warn experimenters “not to forget what you know about your subject-matter field! Statistical techniques are most effective when combined with subject-matter knowledge.” They allude to a chasm that remains to this day between data scientists and domain experts.
No Assumption Of Prior Knowledge of Statistics
They also assume a reader who is an experimenter but has no prior knowledge of probability theory or statistics. Given that the subject has since made its way into Middle School curricula, it should be a pessimistic assumption.
Screening and Response Surface Methodology (RSM)
Semiconductor process engineers who practice DOE distinguish between Screening experiments — intended to select which four or five parameters influence the outcome of a process — and Response Surface Methodology (RSM) — the search for the optimal combination of values for these parameters. Statistics for Experimenters covers RSM but only briefly mentions Screening, which is the subject of a separate 2006 book.
Screening
Between temperatures, pressures, flow rates, tool wear, humidity, etc., there may be tens of factors that can influence the outcome of an operation in a machine. Screening uncovers the handful that actually matters. Initially, we don’t know which factors they are.
It sounds like dimensionality reduction, commonly done by factor analysis but this technique does not apply here because the factors it identifies are not variables you can control and observe but functions of several of these variables. You can directly program furnace temperatures and flow rates, but not a factor that is a combination of the two.
For a liquid flowing in a pipe, for example, the Reynolds number is a function of the velocity, pipe diameter, liquid density, and viscosity that is useful in determining whether the flow is laminar or turbulent. On the other hand, it’s neither a quantity you read from a sensor nor a control you set with a dial, which is what you screen for.
Screening from Historical Records
If you have historical records, screening is a data mining problem. Otherwise, you collect the data specifically for this purpose, and it’s DOE. In 2020, sensors, the Industrial Internet of Things (IIoT), and supervisory controllers (SCADA systems), have made it easier than ever and the greatest challenge may be to exercise restraint. Just because you can collect 100 temperature readings per second does not mean you should. It’s prudent to collect more than you think you need, but not 1,000 times more.
If you have collected a large number of parameters, you can, for example, fit a linear regression model to predict the outcome from these parameters. Modern regression tools then give each parameter a significance star rating and you can take a first-cut at screening, by weeding out all the low star ratings. If there are still too many parameters, you can use stepwise regression or all subset regression to zoom in on a handful accounting for the bulk of the variability of the outcome. When you use this method, domain knowledge goes into the regression formula.
Screening Experiments
If you don’t have historical records, you conduct screen by experiments on many factors but focussing exclusively on their individual contributions, ignoring interactions. To analyze interactions, you use RSM.
Dorian Shainin’s Red X
Dorian Shainin, a pioneer in the use of DOE in Manufacturing, advocated screening to identify the single Red Xfactor that accounts for most of the variability in the output. If it is a parameter you can control, like a furnace temperature, you reduce its variability by process engineering; if it’s not, like the composition of an ore or a clay dug out of the ground, you mitigate its variability by mixing materials from several lots or you compensate for it by tweaking the process.
In the Overview of the Shainin System, causes of variability are assumed to contribute additively to the variance of the output, which is true only if they are uncorrelated. You don’t need any such assumption when using regression as above.
Response Surface Methodology (RSM)
Statistics for Experimenters co-author George Box and K. B. Wilson coined the term Response Surface Methodology (RSM) in 1951. Amazon today offers 108 books on RSM, the most highly ranked being the 3rd edition, from 2016, of a textbook from 1995, which suggests it’s a stable, mature body of knowledge.
One Factor At A Time (OFAT)
The original approach was One-Factor-At-a-Time (OFAT). Starting from where you are, you hold all factors but one constant and find the optimum for this factor. Then hold it at this value and repeat the process for a second factor, and so on. Besides being time-consuming, this approach only finds a global optimum if the factors are uncorrelated.
Interactions
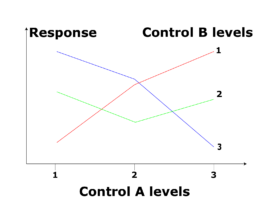
With correlated factors, OFAT won’t take you to the optimum. You need to take into account their interactions and filter out the effect of noise. The issue of interactions between inputs is well illustrated by photographic cameras. The following picture compares control of a Digital Single-Lens Reflex (DSLR) with a 1950s vintage Rolleiflex:

In the DSLR, one control wheel allows you to tell the camera that you want to take sports pictures, a landscape, a portrait, or a close-up of a flower. The settings are in terms of the pictures you want to take. The controls on a 1952 Rolleiflex, on the other hand, are settings on features of the camera that have interactions:
- The photographer decides which kind of film to use. All the other settings depend on its sensitivity. The high-sensitivity film is easier to work with but the pictures are grainier.
- The smaller the aperture, the wider the range of distances — the depth of field — for which the picture is sharp but the longer the exposure needs to be in order to shine enough light on the film.
It is up to the photographer to choose the film sensitivity and set the aperture, exposure, and distance for the picture to come out right. All these inputs interact but in ways that the camera manufacturer understood well enough to provide settings guidelines on the back of the camera. You don’t need experiments but serious photographers do experiment to understand what their equipment can do, and experimenting with film involves the costs and delays of processing.
From Amateur Photography to Semiconductor Wafer Processing
Semiconductor manufacturers cycle silicon wafers through dozens of photolithography steps that have similar issues with film photography. They spin an emulsion of photoresist on a wafer, and expose it section by section through a mask to pattern it, using rays that, over decades, migrated from visible light to ultraviolet and now extreme ultraviolet (EUV). This process, like film photography, is subject to interacting controls of aperture and exposure time.
By opening up, you let more rays through. It reduces the exposure time and increases capacity. In doing so, however, you also reduce the depth of field and, with line widths on the order of 200 nm, the slightest warpage in the wafer can locally blur the pattern, and you need experiments.
Factorial Experiments
Astakhov illustrates the concept with a cake taste experiment having four input factors:
- Oven temperature
- Sugar quantity
- Flour quantity
- Number of eggs
With two settings for each, that’s 2^{4} = 16 combinations of settings to bake cakes with, randomizing the sequence as needed to filter out the influence of factors that are not part of the experiment, like the chef or the egg carton.
Then you use the data to assess the influence of each factor and of interactions between factors. You can group the data by any combination of factors, compute Fisher’s ratio of the variance of the target output between and within groups and, if it is deemed significant, use the group means to estimate the output produced by this combination of factors.
Full factorial experiments
In a full factorial experiment, you generate data for all 16 combinations of settings and are able to analyze all the factors individually, in pairs, in triplets, and all four together. That’s all the non-empty subsets of the set of factors, of which there are 2^4 - 1 = 15
While this is work, it is considerably less than running separate experiments for each factor individually and for each pair, triplet, etc.
The work of doing full factorial experiments rises quickly with the number of factors and the number of levels considered for each factor. If you increase to 5 factors with 3 settings for each, the number of combinations for which you need to generate data rises to 3^5 = 243 , to evaluate the effect of 2^5 - 1 = 31 combinations of factors.
Partial factorial experiments
This is why you screen to limit the number of factors to consider. You also need to keep the number of levels or settings for each factor low. It is usually not enough and you also need to use partial factorial designs that include only some of the possible combinations of settings.
The idea is to take advantage of the usually decreasing effect of combinations of factors when you include more. Individual factors contribute more than pairs, which contribute more than triplets, etc. The two Oven temperature settings alone will account for more of the variance in the result than combinations of settings for Oven temperature, Sugar quantity, Flour quantity, and Number of eggs. You take advantage of this to generate partial factorial designs when adding new factors.
Taguchi Methods
Genichi Taguchi popularized his concepts in the US in the 1980s and they are still referenced as the state of the art for DOE applied to manufacturing quality. They are focused on the elimination of variability. Some of Taguchi’s concepts are straightforward, like the quadratic loss function but others are dauntingly complex, which may explain why they are not more widely used.
Robust design
“Robust design” is an alternative and more descriptive name for Taguchi’s methods, used in particular by his associate at Bell Labs, Madhav Phadke. The key idea is to search for the combination of controls that is least sensitive to noise.
Firing ceramics in a kiln is notorious for introducing variability in product dimensions, often requiring the binning of finished goods. Phadke cites the case of a Japanese tile company that Taguchi worked with. The engineers established that the dimensional variations were related to temperature differences due to the positions of the tiles within kiln carts.
They first proposed modifying the kiln but then realized that the variability could be reduced simply by increasing the lime content of the clay. A change in the product design made the outcome less sensitive to temperature differences and therefore the process more robust.
Quadratic Loss Function versus Tolerances
The idea behind tolerances is that, if the critical characteristics of a product unit all fall anywhere within an interval, the unit works. If there are 45 critical characteristics, their tolerance intervals form a 45-dimension hypercube. The actual space of critical characteristics for which the unit works can be of any shape and the target is to make the tolerance cube small enough to fit within that shape, yet no so small that it is beyond the capability of the process.
If you apply this logic rigorously, your loss is 0 if the unit is anywhere inside the cube and constant outside of it, because you reject the unit anyway. It doesn’t matter whether you missed the interval by an inch or a mile.
The Concept of Tolerances
According to Hounshell, the concept of tolerance was introduced in the late 19th century to resolve conflicts between production managers who insisted the output of their shops was close enough to target values and inspectors who rejected it for not being on target. It was a compromise meant to enable production to function.
Deviations from target often do not have the same consequences in both directions. If a rod is slightly too long, you can grind it down to the right length; if too short, you have to scrap it. In other words, the losses are higher on one side of the tolerance interval than the other. The machinists will aim for the top rather than the center of the interval, and the actual length distribution will be off-center.
The effect on the final product of this kind of adjustment over thousands of characteristics is difficult to predict. The safest conclusion to draw is that, on the one hand, having any characteristic outside its tolerance interval is enough to brand a unit as defective but, on the other hand, that having all characteristics within their tolerance intervals does not guarantee its quality. That’s why most manufactured products still undergo a final test at the end of their process.
Target Values Versus Tolerances
The target values are what the designers decided was best for the product, which production ignores when treating all the values in the tolerance interval equally. Taguchi’s loss function is 0 only at the target value, and then grows like the square of the distance to target. Experimenting to minimize it honors the designers’ choices. The following figure, from Madhav Phadke’s book, compares the Taguchi loss function with the traditional one based on tolerances.
This logic is relevant near the target value, inside the tolerance interval. Outside of it, you are back to a logic where your loss is the same whether you are close or far.

Taguchi’s Justification for the Quadratic Loss Function
With his quadratic loss function around a target value, Taguchi’s loss function shifted emphasis from aiming for characteristics within a tolerance interval to aiming for a target value. While actionable and useful, this concept is also arbitrary. Taguchi justified it in terms of two equally wobbly and unnecessary foundations: loss to society and cost of quality.
When working on manufacturing quality, you are focused on making products that match customer expectations. Whether failure to do so translates a loss to society depends on what kind of product it is, as it could be cigarettes or a cure for lung cancer. In any case, the translation of this idea to numbers is anything but obvious. This notion has a Confucian ring to it that makes it unhelpful in societies that are not influenced by Confucianism.
Cost of quality, on the other hand, is usually defined as the sum of failure, appraisal, and repair costs. Accountants can provide numbers but they usually do not begin to address the business consequences of quality problems, which are predominantly about reputation.
Signal-to-Noise Ratio
Taguchi splits the inputs into Signal Factors and Control Factors. The Signal Factors are the user settings on a product or a machine when running it. The Control Factors are parameters set at design time. They are the characteristics of the hardware and software it is built from. The Noise Factors, as before, are outside the control of the user or the designer.
The objective of the Taguchi experiment is to identify the control factors so as to maximize a “signal-to-noise ratio” defined as the square of the coefficient of variation of the output, expressed in decibels. This idea has not been universally accepted by statisticians.
Orthogonal Arrays
Taguchi has developed a theory of orthogonal arrays for fractional designs with tables of settings for series of experiments, interaction tables, and graphs of the factors and interactions analyzed in an experiment. As Taguchi did this work before becoming aware of Fisher’s theories, there are differences between his orthogonal arrays and factorial designs, as discussed by Scibilia (2017).
The Original Six Sigma
While it’s not obvious from recent literature, DOE was, in fact, the core technical content of the original Six Sigma in the 1980s, before Six Sigma training dialed back to SPC.
Motivation at Motorola
Motorola then was a high-technology company where product and process development required extensive experimentation throughout product life cycles of a few short years. Experimentation was hobbled by the disconnect between engineers who understood device and process physics on the one hand and statisticians trained in DOE on the other.
The engineers didn’t see the value of learning DOE and the statisticians didn’t know enough about the technology to communicate it. The industry needed armies of people proficient in both disciplines and only had a handful.
The Black Belts
The idea of Six Sigma was to package a subset of DOE for massive use by engineers. The idea was to give statistical training to 1% of the work force and let them be a resource for the remaining 99%. The Black Belts were not expected to be PhD-level statisticians, but process engineers with just enough knowledge of modern statistics to be effective.
Besides sounding more assertive than “staff statistician” and making an imaginary connection with Japan, the Black Belt title also made sense because there is a parallel between Six Sigma and martial arts training.
Traditional masters in the martial arts of China trained one or two disciples at the Bruce Lee level in a lifetime, just as universities train only a handful of experts in statistical design of experiments who could be effective in electronics manufacturing. One Karate instructor, on the other hand, can train hundreds of Black Belts, just as a Six Sigma program could teach a subset of DOE to hordes of engineers.
Conclusions
Should Manufacturers use DOE? Except in a few niches, there is today little evidence that the managers of Manufacturing organizations think so. It doesn’t mean they are right. It does mean that DOE boosters have failed to make a compelling case that the investment in mastering this complex body of knowledge pays off. To the extent it does, the opportunity for manufacturers to gain a competitive advantage from it is still present.
For the Curious
There are many books and articles about experimentation and DOE, with overlapping content. They are listed here in reverse chronological order:
- Strevens, M. (2020) The Knowledge Machine: How Irrationality Created Modern Science Liveright, ISBN: 1631491377 Tabandeh, F., Alahyari, S., Nejatian, M., Darabzadeh, N. (2020) Principles of Statistical Design of Experiments, Referenced only on ResearchGate.
- Scibilia, B. (2017) How Taguchi Designs Differ From Factorial Designs, Quality Digest, 2/26/2017
- Myers, R.H., Montgomery, D.C., Anderson-Cook, C.M. (2016) Response Surface Methodology – Process and Product Optimization Using Designed Experiments, 3rd Edition, Wiley, ISBN: 9781118916032
- Lawson, J. (2014), Design and Analysis of Experiments with R, Volume 115 of Chapman & Hall/CRC Texts in Statistical Science, CRC Press, ISBN: 9781498728485
- Moen, R.D., Nolan, T.W., Provost, L.P. (2012) Quality Improvement Through Planned Experimentation 3/E, 3rd Edition, McGraw-Hill Education, ISBN: 978-0071759663
- Astakhov, Viktor P. (2012) Design of Experiment Methods in Manufacturing: Basics and Practical Applications, In book: Statistical and Computational Techniques in Manufacturing
- Wu, C.F.J., Hamada. M.S. (2009) Experiments: Planning, Analysis, and Optimization 2nd Edition, Wiley, ISBN: 978-0471699460
- Sawada, Z., Kato, M., Hanamura, K., Fujii, H., Hashino, Y. (2008) トヨタ生産方式で品質管理を徹底するためのキーワード集 (Keywords for thoroughly implementing Quality Control with the Toyota Production System), Nikkan Kogyo, ISBN: 4-526-05369-4
- Steiner, A, Mackay, R., Ramberg, J. (2008) An Overview of the Shainin System™ for Quality Improvement, Quality Engineering, Vol. 20, 10.1080/08982110701648125
- Montgomery D.C., Jennings C.L. (2006) An Overview of Industrial Screening Experiments. In: Dean A., Lewis S. (eds) Screening. Springer, New York, NY, ISBN:
- Myers, R. H. and Montgomery, D. C. (2002). Response Surface Methodology: Process and Product Optimization using Designed Experiments, second edition. John Wiley and Sons, New York.
- Box, George E.P., Hunters, William G, & Hunter, J. Stuart, (2005) Statistics for Experimenters, 2nd Edition, , Wiley-Interscience, ISBN: 978-0471718130
- Taguchi, G., and Clausing, D. (1990) Robust Quality, Harvard Business Review, Jan-Feb. 1990
- Harry, M. & Lawson, R. (1990) Six Sigma Producibility Analysis and Process Characterization, Motorola University Press, Publication Number 6σ-3-03/88
- Phadke, Madhav S. (1989) Quality Engineering Using Robust Design, Prentice Hall, ISBN: 0-13-745167-9
- Hounshell, D. (1984) From the American System to Mass Production, 1800-1932, Johns Hopkins University Press, ISBN: 978-0801831584
- Diamond, William J. (1981) Practical Experiment Designs, Lifetime Learning Publications, ISBN: 0-534-97992-0 * Fisher, Ronald A. (1974) The Design of Experiments, Ninth Edition, Hafner Press
- Fisher, Ronald A. (1950) Statistical Methods for Research Workers, 11th Edition, Oliver and Boyd, London, UK
Software for DOE
It is almost a given that any engineer wanting to get started with DOE will reach for Excel first, and a Google search of “Excel + DOE” will provide links to templates, macros, add-ons, and video tutorials. The literature above, however, references specialized software products:
- JMP, from SAS, used in An Overview of Industrial Screening Experiments
- Minitab used in Six Sigma.
- R packages cited by Lawson in Design and Analysis of Experiments with R: gmodels, MASS, agricolae, multcomp, car, daewr. BsMD, lme4, FrF2, AlgDesign, leaps, DoE.base, GAD, lsmeans, crossdes, Vdgraph, rsm, constrOptim, mixexp
#doe, #experiment, #experimentaldesign, #fisher, #taguchi, #lean, #tps, #semiconductor, #pharmaceuticals
October 31, 2020 @ 9:11 am
Michel, another Baudenesk treatment, thanks. We have used DOE extensively in the plastic injection molding industry but the use compared to the opportunity is but a small fraction. As for your question about the use-to-talk ratio (TR=USE/Talk) of DOE in manufacturing, for the most part it approaches zero as you might expect. The phenomenon could best be characterized as I characterize the majority of business meetings I am required to attend, “After all is said and done; a lot more was said – than done”
October 31, 2020 @ 11:55 am
Thanks for the information.
Could you elaborate on the use of DOE in injection molding? What were the problems? Which methods did you use? Which departments were involved? Were the conclusions enacted?
Assume you are talking to a freshly minted chemical engineer who, on the advice of a family friend to go into “Plastics,” joined an injection molding company. Would you recommend training in DOE? If so, which flavor? Box, Hunter & Hunter, Shainin, or Taguchi?
October 31, 2020 @ 3:21 pm
In late 1980s I was a recently-hired Quality Engineer at a lithium battery factory when I managed my first DOE – a simple 2^3 factorial.
The problem: manufactured batteries resulted in lower capacities than what was submitted in prototype testing. I was working with many chemists and chemical engineers (PhDs) and felt like I was in over my head (first battery mfg job). The results of my experiment demonstrated very clearly what was causing the drop in capacity. It was new knowledge for the company and the solution was a very easy fix – they still do it today.
This project convinced me that DOE is a body of knowledge that I need to pursue further.
In his article Statistics for Discovery, George Box mentions a young hire at SKF Bearings who ran a 2^3 factorial that resulted in new knowledge for SKF and a five-fold increase in bearing life.
October 31, 2020 @ 4:54 pm
Thanks for the example. How much DOE have you been using since the late 1980s?
October 31, 2020 @ 5:13 pm
Comment in the TOC-Lean-SixSigma group on LinkedIn:
October 31, 2020 @ 5:17 pm
I remember a case where operators taking thickness measurements on a plate rounded off the last two significant digits captured by the caliper, where all the variation was…
Hopefully, in 2020, some manufacturing organizations are beyond this kind of things.
October 31, 2020 @ 5:21 pm
Comment in the TOC-Lean-SixSigma discussion group on LinkedIn:
October 31, 2020 @ 6:17 pm
Yes I would recommend it, there is a lot of opportunity, especially financial opportunity. However, a problem with DOE is the small sample sizes so a few pieces of bad data will ruin a good design.
The first thing we did was work on MSA to make sure we had good measurement systems, that was a gold mine just waiting to be harvested. With the application of MSA alone we made huge strides in reducing scrap. Plastic is compressible and there is lots of shrinkage, hence, parallel surfaces are never parallel and circles are most frequently ovals. You need to have good operations definitions for the measurement of these characteristics; then good MSA; and finally people trained to make the measurements. That’s no, 1, good measurements.
Second, before doing any DOEs they should perform capability analyses using SPC to get and confirm at least a reasonable level of process stability. Standard Shewhart control charting should be a staple. Then, after confirming you can measure well and you have a reasonable level of process stability, do the DOEs. Stable processes is second. Sounds like a lot of work but for a typical part with 3-5 critical characteristics, it’s a day or two of work for an engineer, and then a few hours to train those measuring whether they are quality folks or inspector-packers.
Most of the DOEs we performed focused on two issues. Finding the best operating parameters to reduce, eliminate defects. These machines have dozens and dozens of parameters that cover large ranges and most of the variables interact one with the other. We also did many DOEs to reduce cycle time.
The cost for Injection molded parts is largely two factors, the cost of the plastic if often 65% of part cost and machine cost is around 150$/hr (depend in size). So raw material utilization and machine capacity are two bid knobs to turn to affect the bottom line. But the slickest ones we did was using DOE to increase the fraction of regrind you could put into the machine and still get parts that meet standard.
At one plant we were so successful we consumed all the regrind from all parts (scrapped parts as well as runners etc) and bought regrind on the open market, backing our raw materials. although the machines were not highly sensitive to the % regrind, normally machine parameters would need to be reset. the biggest challenge was that the set up techs, were convinced that set ups were an art and somehow the laws of physics did not apply. Since the rest of the place counted heavily on their input, this was a common, although grossly incorrect paradigm. This created a human problem, since we were picking away at this paradigm, the setters were offended and often doing the DOEs was a battle.
Since we had done MSAs and capability studies and reviewed the process history we had a good deal of intimate process information. then with the process setters, the process and designs engineers, and often the materials suppliers we would meet to define the design It was usually some form of brainstorming with cards to get an initial design.
From there the first experiment was usually a Plackett-Burman (I’m a fan) then we’d narrow down the design and very likely do a fractional factorial typically a 2 to the 6-3, for example followed by a full factorial, often a 2 to the 3 or sometimes 2 to the 4. Like I say there are lots of interactions. On one occasion the head of the process techs became a true believer and we actually did some EVOP. Without exception, we were successful, sometimes more, sometimes less, but we always made money and like the examples of optimizing regrind, we made tons of money. It was fun and everyone can do it, but predictable, like I said earlier, after all is said and done, more is said – than done. Sorry to be so windy … but you asked.
Finally, which method? For this type of work I did not find Shainin techniques to be very helpful. I think they are way off base with their perspective of SPC and their preoccupation with Precontrol, but their methods do have merit, especially in the world of electronics where they were created, and they do have applications elsewhere.
As for Taguchi designs, that is really good stuff, but they have fallen out of use and a lot more information and help is available with the standbys of full and fractional factors and Box, Hunter and Hunter has been the DOE bible for me since I started studying it in the 80s; in work like plastic injection molding with tons of significant 2 and even 3-factor interaction good screening designs are a must, no one does a better job on that then BHH, and I would say Montgomery is next.
Regarding the method you choose, some are better, but that is not the most important factor as long as you make sure you and others can execute it and believe in it. But more important than the method you choose is the approach and how you (1) get good data, (2) include the right group of people involved so they will actually use it and (3) consider a DOE as the starting point, not the end point to your new found understanding. With a good design and a clear and curious mind, following the DOE you surely will get some good answers, but more importantly you will have more questions, deeper and more consequential. Be well and if you’d like more, just write or call
Sorry about being so long-winded, but in my defense … you did ask
November 1, 2020 @ 2:48 am
Very nice and interesting historical survey.
I will show it to my students
Michel
November 1, 2020 @ 5:07 am
Lonnie, this is exactly what I was looking for. Thank you.
MSA stands for “Measurement System Analysis”
EVOP, per Tony Burns, is the following:
November 1, 2020 @ 5:21 am
Comment in the TOC-Lean-SixSigma discussion group on LinkedIn:
November 1, 2020 @ 7:52 am
Michel, in my long-winded post I forgot probably the most important impact ands since no one mentioned it, I run the risk of offending a whole bunch, but here goes.
The biggest problem I see with DOE application is that it is treated with cult-like passion and often done in such a ham-handed fashion that the experiments are not useful. Handling the data, intimate process knowledge I have already discussed. If some DOE expert who is unfamiliar with your processess professes he can improve them, immediately check to make sure your wallet is still there.
If on the other hand he tells you he can teach you some cool tools, and that if you couple those skills with your intimate process knowledge, you have a good helper. furthermore, if he tells you even the basics of and the implications of probability and tells you to make sure to keep your common-sense antennae at full extension, now you have a really, really good helper.
For example, you do a 2 the fourth full factorial and find only one major factor with a p-value that meets the standard of 0.05 max … which is totally arbitrary, (normally based on 1.96sigma in DOE, 2.58 in MSA, and 3.0 in SPC) you are blindly following some rule that is not always in your best interest.
Apply a little common sense for a second – this seldom taught. Let’s say in the full factorial above, in addition to the one significant major factor you get 4 responses with p values of 0.25, these would normally be discarded as insignificant. But put them all together and odds are 2 or 3 may improve your solution by some amount.
We teach people to make a 2 by 3 graph and evaluate each of these effects, whether interactions or not and apply what we call “FEF squared” logic: Fix ’em Fast, Find ’em Fast. To do this, evaluate each response as (1) Easy to do/hard to do, (2) Will get fast feedback/will get slow feedback and (3) risk of failing is large/risk of failing is small.
Then take those with an acceptable risk level and using the remaining 2×2 matrix and start with those within the “fast feedback/easy to check” quadrant; often this can be done with an OFAT (one factor at a time). You will be amazed at what you can find. It is a way of extending the learning without the concerted effort of another DOE.
Too often these technologies; be it DOE, TOC, Lean, Six Sigma or whatever are taught and absorbed with cult-like attention – while the rest of your mind is told to “take it easy cuz we have all the answers here.” Just my 2cents….be well
November 1, 2020 @ 8:23 am
Comment on LinkedIn:
November 1, 2020 @ 8:28 am
Comment on LinkedIn:
November 1, 2020 @ 11:51 am
Very little unfortunately. In the battery industry we used DOE several times but barely used in other industries.
Thanks again for another informative blog post.
November 1, 2020 @ 10:48 pm
Very important and useful tool. But, as you said it is not used much in industry. I myself have used it only once in industry (finding parameters for injection molding a tricky part). I also tried to teach others the method.
Do you know the matrix formula (TxM)^(-1)Ty where M is the matrix with the model variables in the column and the experiments in the row; T is the transpose thereof, and Y is the results of the experiments. The output is the best fit for the model. Works also for more than full factorial experiments (i.e. more experiments than model parameters). Using excel I found it almost ridiculously easy to do a DOE.
November 2, 2020 @ 6:02 am
Comment on LinkedIn:
November 2, 2020 @ 6:39 am
Comment on LinkedIn:
November 2, 2020 @ 12:21 pm
very insightful
Process Capability Indices – Michel Baudin's Blog
November 13, 2023 @ 2:31 pm
[…] Taguchi added the concept of a target T for the variable X,, which does not necessarily match its expected value mu. You are not just shooting for X to fall anywhere within the tolerance interval left [ L,U right ],; you are going for a specific target T within this interval, and you incur losses that increase with the difference between X and T. In Taguchi’s model, the losses are quadratic – that is, proportional to (X-T)^2. Consistent with this approach, Taguchi reduces the target-free C_{p_k} by dividing it with a factor that is a function of (mu – T)^2 and reduces to 1 when mu =T. […]
Tolerances – Michel Baudin's Blog
November 29, 2023 @ 5:28 pm
[…] In engineering, on the other hand, there is a difference between the two forms, even if L = T-C and U = T+C. The interval format suggests that it makes no difference where in the value falls between between L and U, whereas the T pm C form suggests that T is a target value, that pm C bounds the deviation from target, and that, within these bounds, values closer to T are better. This is the root of the Taguchi method. […]
Virtual Design of Experiment: How to optimize your production processes through digital tools | EthonAI
December 19, 2023 @ 1:23 am
[…] DOE is a statistical method designed to experimentally assess how specific parameters influence outcomes in manufacturing processes. Its origins date back to Ronald Fisher in the 1920s, initially for agricultural applications. In the 1980s, Genichi Taguchi’s methods notably advanced its use in manufacturing. However, DOE’s full potential remains underexploited in the industry, especially outside of sectors like pharmaceuticals and semiconductors. This is often because of the significant time and effort required to master DOEs, which combine statistical know-how with domain-specific knowledge (for an in-depth overview of DOEs, we refer interested readers to Michel Baudin’s blog). […]