May 6 2020
The Math of COVID-19, And Factories
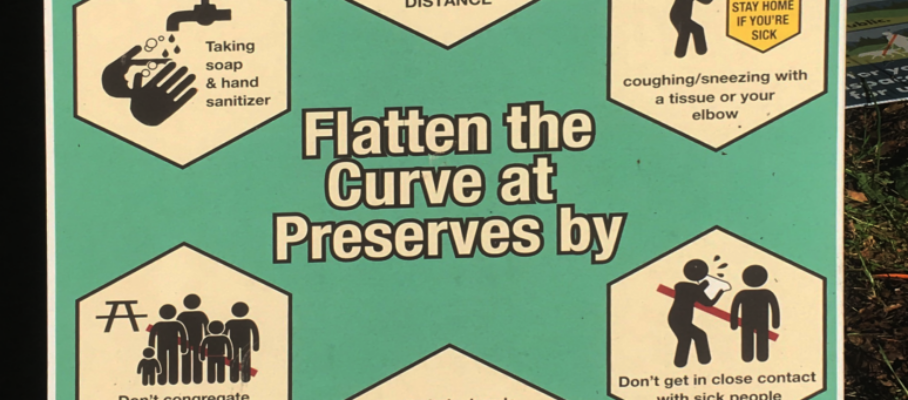
Whether we like it or not, the past months have given us a crash course in epidemiology. COVID-19 has taken terms like reproduction number, herd immunity, social distancing, or flattening the curve from research literature to daily news and instructions for visitors to California State Parks.
We are in the middle of a pandemic we have partially tamed by putting the economy in a coma. This pandemic has already killed more Americans in two months than the Vietnam war in 20 years and we are facing the unprecedented challenge of restarting factories in this context.
Among the many things to learn in a hurry, are what epidemiologist Adam Kucharski calls the rules of contagion, as they apply to the people who work in a factory and its surrounding community.
Quality control is the closest most of us in Manufacturing ever get to serious statistics/data science. It’s not the same domain as epidemiology, and there is little crossover in tools or methods. This is to share what I have just learned about this topic. I welcome any comment that might correct misconceptions on my part or otherwise enlighten us.

Aug 3 2020
Process Behavior Charts and Covid-19 | Donald J. Wheeler | Quality Digest
“Many schemes, ranging from simple to complex, using process behavior charts with Covid data have been tried. But regardless of their complexity, they all come up against the fact that epidemiological data do not represent a steady-state system where we need to discover if assignable causes are present. Process behavior charts simply ask the wrong questions here. When dealing with data from a dynamic system where the causes are well understood, the data will create a running record that can be interpreted at face value. The long-term changes will be sufficiently clear so that further data analysis becomes moot.
So, while specialists may use epidemiological models, when it comes to data analysis by nonspecialists we do not need more analysis, but less. We need to draw the graphs that let the data speak for themselves, and then get out of the way. As always, the best analysis is the simplest analysis that provides the needed insight.”
Sourced : Quality Digest
Michel Baudin‘s comments: Don Wheeler is correct that process behavior charts are not a fit for data about the pandemic. Non-specialists, however, cannot ignore epidemiological models for several reasons:
That's why I took a stab at learning and sharing about them in a few recent posts:
#covid19, #coronavirus, #epidemiology, #pandemic
Share this:
Like this:
By Michel Baudin • Press clippings 0 • Tags: Coronavirus, COVID-19, Epidemiology