Michel Baudin's Blog
Ideas from manufacturing operations
  • Home
  • Home
  • About the author
  • Ask a question
  • Consulting
  • Courses
  • Leanix™ games
  • Sponsors
  • Meetup group

Oct 22 2011

This is a poll for managers and engineers

This is a poll for managers and engineers working in factories: how to you use manufacturing data? Please answer on http://linkd.in/ogOsOv, and comment if none of the choices fit you.

Share this:

  • Click to print (Opens in new window) Print
  • Click to share on Facebook (Opens in new window) Facebook
  • Click to share on LinkedIn (Opens in new window) LinkedIn
  • Click to share on Reddit (Opens in new window) Reddit
  • Click to share on X (Opens in new window) X
  • Click to email a link to a friend (Opens in new window) Email

Like this:

Like Loading...

By Michel Baudin • Polls • 3 • Tags: Data mining, Information systems, Information technology, IT, Lean manufacturing

To get to Dublin, you don't start from here

Oct 22 2011

Kaizen without prerequisites

Question from Pedro Burgos: You have an assembly line where ‘Standardized Work’ is not utilized. The operators have ‘work instructions’ and follow them. They do not miss steps. But there are differences between operators in how the work is performed in terms of sequence. All of them perform under takt time, some more than others. Due to ‘wastes’ of motion. You are asked to do a Kaizen to reduce inventory quantities and space. Inventory quantities on the production floor varies, some parts have 3 days of inventory, some have 2 days, some have 1 day (16 hours). The goal is a ‘kanban’ of 2 hours of inventory in the assembly line. Do you think is possible to do this Kaizen? (Discussion in the LinkedIn Global Lean & Six Sigma Network)

Your question reminds me of the old story about asking a farmer in the countryside of Ireland how to get to Dublin, and getting the answer that “you don’t start from here.” In fact, regardless of its current state, a production line can always be improved.

Looking further at the way you describe the challenge, however, several things disturb me. First, while Kaizen, meaning improvement, is always possible, “a Kaizen” seems to designate a Kaizen event, a project template which is not always appropriate. Second, your description suggests opportunities for productivity and quality improvement, but neither is stated as an objective.

A top-down mandate to use a particular method to pursue two goals like inventory and space reduction does not strike me as a recipe for success. Instead, someone needs to do the following:
1. Take a close look at this assembly line.
2. Identify improvement opportunities in all dimensions of its performance.
3. Select one or two to pursue in priority based on improvement potential, technical feasibility, and human feasibility.
4. Determine the project management approach based on content, rather than the other way around.

This approach is much more likely to achieve the desired inventory and space reductions, among other improvements, than just running a Kaizen event to pursue these objectives directly and exclusively.

Share this:

  • Click to print (Opens in new window) Print
  • Click to share on Facebook (Opens in new window) Facebook
  • Click to share on LinkedIn (Opens in new window) LinkedIn
  • Click to share on Reddit (Opens in new window) Reddit
  • Click to share on X (Opens in new window) X
  • Click to email a link to a friend (Opens in new window) Email

Like this:

Like Loading...

By Michel Baudin • Management • 1 • Tags: industrial engineering, Kaizen, Lean manufacturing, Manufacturing engineering

Oct 20 2011

Webinars on Manufacturing Data Mining and Beyond 6σ

Check out “Manufacturing Data Mining and Beyond 6σ: Two Webinars on November 15 and 16,…” http://bit.ly/qGeTeK via @eventbrite, @mfgdatamining, @beyondsixsignma, #lean, #datamining, #kaizen, #logistics, #tps, #quality

Share this:

  • Click to print (Opens in new window) Print
  • Click to share on Facebook (Opens in new window) Facebook
  • Click to share on LinkedIn (Opens in new window) LinkedIn
  • Click to share on Reddit (Opens in new window) Reddit
  • Click to share on X (Opens in new window) X
  • Click to email a link to a friend (Opens in new window) Email

Like this:

Like Loading...

By Michel Baudin • Events • 0 • Tags: Data mining, Lean manufacturing, Manufacturing

Continuous improvement from bolts to clamps

Oct 19 2011

The Role of Technology in Continuous Improvement

In an article on this topic in Industry Week today, Ralph Keller asserts that Continuous Improvement is focused on business processes rather than technology.

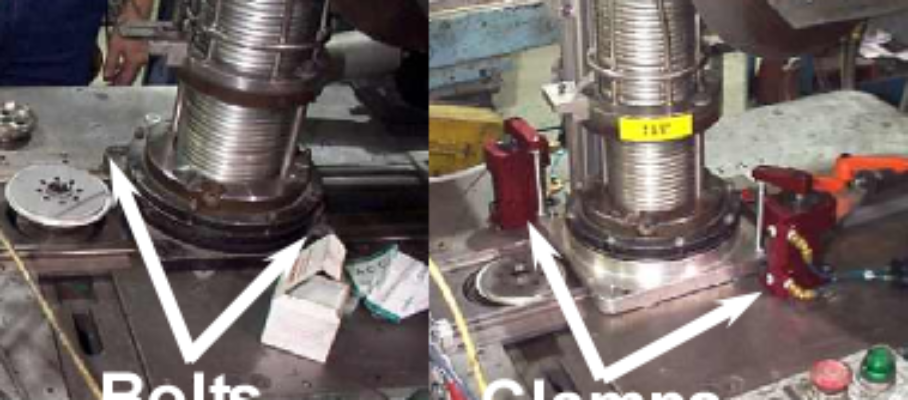
However, if you wrap tinfoil around the feet of a welding fixture to make it easier to clean, replace bolts with clamps on a machine to reduce setup time, or mount a hand tool on the machine on which it is used, it usually counts as Continuous Improvement but involves technical changes to work that I don’t think anyone would describe as business processes.

Yes, Continuous Improvement is done without expensive technology, but it does involve cheap technology.

Ralph Keller also reminds us that Continuous Improvement is not “rocket science,” which implies that it is easier. I agree that it is different, but not easier. I don’t know any rocket scientist with the skills to facilitate Continuous Improvement.

Share this:

  • Click to print (Opens in new window) Print
  • Click to share on Facebook (Opens in new window) Facebook
  • Click to share on LinkedIn (Opens in new window) LinkedIn
  • Click to share on Reddit (Opens in new window) Reddit
  • Click to share on X (Opens in new window) X
  • Click to email a link to a friend (Opens in new window) Email

Like this:

Like Loading...

By Michel Baudin • Management • 0 • Tags: Continuous improvement, industrial engineering, Kaizen, Lean manufacturing, Manufacturing engineering

Speaker competing for attention with laptops, reduced resolution

Oct 16 2011

Meetings, seminars, and laptops

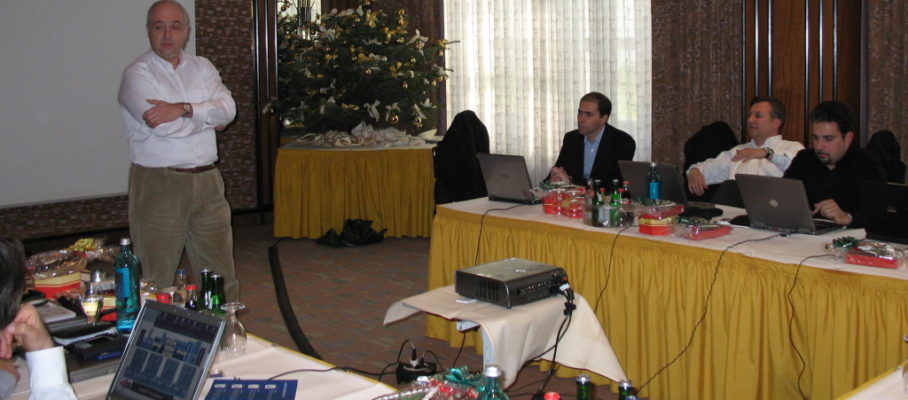
Communicating face to face is supposed to be more effective than electronically. Yet it is common today to see professionals travel thousands of miles to be in the same room and then engage in parallel play on their laptops while one of them is giving a presentation. The speaker stands in front of tables arranged in a U, facing a wall of open laptops. The people behind are silent and focused, and seldom make comments or ask questions. They appear to be taking notes, but in fact, they are completing an unrelated budget spreadsheet, checking emails, or playing solitaire.

It takes the presentation skills of a Steve Jobs to successfully compete for attention with the rest of the world coming to each seat through the web, and most speakers do not have these skills, especially when in a foreign language, and it is also quite possible that the information they have to convey does not lend itself to an entertaining presentation, but today’s business audiences make no allowance for this.  The notion of giving each person a polite hearing, as taught in elementary school, is gone.

The intrinsic discourtesy of this behavior, however, is not the main problem. By providing escapes,web-connected laptops make badly-organized, boring meetings bearable, and allow them to continue unchallenged. Possibly the most tedious of all business rites, the regular staff meeting involves members of a department standing up one after the other and giving a status update on issues that are usually of interest only to themselves and the manager. Without laptops, some members would fall asleep and snore, and others would eventually rebel against this waste of time. And this would lead to a positive change. Wired in to their laptops, they don’t challenge the status quo.

A few years ago, cell phones routinely disrupted meetings,   with their owners leaving the room to take the calls, which were obviously more important than anything the people present in the flesh might have to say.  Today, cell phones disruptions are abating, as meeting participants usually comply with requests to turn them off, or, even better, to “turn them back on at the end of the meeting, so that they don’t miss their important calls.” The current situation with laptops, however, is not sustainable. It is a technology-induced problem, that technology may actually solve. Laptops are an endangered species, likely to be replaced with tablets that do not provide the same kind of visual shield as a raised laptop screen. Already today, people who bring iPads to meetings actually participate in the meetings, as doing otherwise would be too conspicuous.

Share this:

  • Click to print (Opens in new window) Print
  • Click to share on Facebook (Opens in new window) Facebook
  • Click to share on LinkedIn (Opens in new window) LinkedIn
  • Click to share on Reddit (Opens in new window) Reddit
  • Click to share on X (Opens in new window) X
  • Click to email a link to a friend (Opens in new window) Email

Like this:

Like Loading...

By Michel Baudin • Management • 0 • Tags: industrial engineering, Management

Vilfredo_Pareto

Oct 14 2011

Revisiting Pareto

Revisiting Pareto is a paper about the application of the 80/20 law, also known as the law of the vital few and the trivial many and the Pareto principle. It presents new ways of applying it to manufacturing operations and is scheduled for publication in Industrial Engineer Magazine in January, 2012. As a preview, I am including here the following:

  1. The complete abstract of the paper as it will be published.
  2. A section on a simulation of a game leading to the emergence of a Pareto distribution of wealth among players, which was cut from the article because it is meant to stimulate thinking and does not contain actionable recommendations.

Abstract of the paper as scheduled for publication in 1/2012

The Pareto principle, so named by J.M. Juran in the 1940s, is also known as the 80/20 law, the law of the vital few and the trivial many, and ABC classification. It is a simple yet powerful idea, generally accepted but still underutilized in business. First recognized by Vilfredo Pareto in the distribution of farm land in Italy around 1900, it applies in various forms to city populations as counted in the 2010 census of the US, as well as to quality defects in manufacturing, the market demand for products, the consumption of components in production, and various metrics of item quantities in warehouses.

The key issues in making it useful are (1) to properly define quantities and categories, (2) to collect or retrieve the data needed, (3) to identify the actions to take as a result of its application and (4) to present the analysis and recommendations in a compelling way to decision makers.

In the classical Pareto analysis of quality problems, defect categories only partition the defectives if none has more than one type of defect. When multiple defects can be found on the same unit, the elimination of the tallest bar may  increase the height of its runner-up. With independent defect categories and an electronic spreadsheet, this is avoided by calculating the yield of every test in the sequence instead of simply counting occurrences, and multiplying these yields to obtain the yield of a sequence of tests. We can then plot a bar chart of the relative frequencies each defect in the population that is actually tested for it, and, as a cumulative chart, the probability of observing at least one of the preceding defects.

When analyzing warehouse content, there are usually too many different items to count physically, and we must rely on data in the plant’s databases.  The working capital tied up by each item is usually the most accessible. But physical characteristics like volume occupied, weight or part count are often scattered in multiple databases and sometimes not recorded. The challenge then is to extract, clean, and integrate the relevant data from these different sources.

In both supply chain and in-plant logistics, the design of the system should start with an analysis of part consumption by a production line in terms of frequency of use, another quantity that is not additive across items. In this application, the classical Pareto chart is replaced by the S-curve, which plots the number of shippable product units as a function of the frequency ranks of the components used, and thus provides a business basis for grouping them into A-, B- and C-items, also known as runners, repeaters and strangers.

The presentation of the results should be focused on communication, not decoration,  and use graphics only to the extent that they serve this purpose.

Emergence of the Pareto distribution in a simulation

While the Pareto principle can be easily validated in many contexts, we are short on explanations as to why that is.  We do not provide one, but we show how, in a simulation of a multiple-round roulette game in which each player’s winnings at each round determine his odds in the next one, the distribution of chips among the players eventually comes close to the 80/20 rule. This happens even though it is a pure game of chance: players start out with equal numbers of chips and have no way to influence the outcome.

Assume we use a roulette wheel to allocate chips among players in multiple rounds, with the following rules:

  1. On the first round, the players all have equal wedges of the roulette wheel, and the roulette is spun once for each chip.
  2. On each following round, each player’s wedge is proportional to the amount he won on the preceding round.

This is a pure game of chance. There is nothing players can do to influence the outcome, and the players who do best in one round are set to do even better on the next one. It is also a zero-sum game, in that whatever a player wins comes out of the other players’ hands. There is no safety net: a player with no chips after any round is out of the game.  If you know the present state of the game –how many chips the player in each rank has– then the results of future rounds is independent of the path by which you arrived at the present state. Technically, it is a random walk and a Markov process. The concept of the game is shown in Figure 1.

Figure 1. Simulation concept

It could be viewed as a representing a simplified Oklahoma Land Rush, where farmers of equal talent are initially given identical plots of land. Even in the first round, some plots will have higher crop yields than others. If the average crop is needed to survive, the farmers with a surplus sell it to the farmers with a shortfall in exchange for land and start the next season with land in proportion to the crop they had on the previous one.  The players could also be functionally equivalent, similarly priced consumable products sold in the same channels, like toothpaste or soft drinks, and the chips would be the buyers of these products.

If we run this game through enough rounds, do we tend towards a distribution where 20% of the players hold 80% of the chips, or do all the chips end up in the hands of only one player? We simulated this game in software with 1 million chips to be divided among 1,000 players in 100,000 rounds, and the simulation takes about 2 minutes to run on a desktop PC.

The results show that the “wealth distribution” is stable, beyond 10,000 rounds, with 23% of the players collectively holding 80% of the chips Figure 2 shows the distribution after 100,000 rounds, which roughly satisfies the 80/20 law, but not recursively, because it takes the top 49% of the players to account for 96% of the chips, instead of 36%.

Figure 2. Chip distribution after 100,000 rounds

Figure 3 shows other indicators of the simulation results every 10,000 rounds. The proportion of the top players holding 80% of all the chips oscillates between 21.5% and 25%, with a very slow downward trend. The number of chips held by the top 10 players also varies, but is essentially flat.Figure 3. Indicators every 10,000 rounds

This pure game of chance, which favors at every round the winners of the previous round, does not rapidly concentrate all the chips in a few hands. Instead, it produces a distribution that is as close to Pareto’s as anything we can observe in demographics, quality, or production control. This suggests the following two conclusions:

  1. The reason the 80/20 law is so often verified with actual data that it does not require some categories to be “better” than others. A long random walk is sufficient to produce it, even when you start out with equal quantities assigned to each category. The products that are Runners are not necessarily better in any way than the Repeaters or the Strangers. From the point of view of Manufacturing, it does not matter why or how they became Runners: as long as they dominate the volume, they need dedicated resources.
  2. If some categories are intrinsically better able to attract the quantity to be distributed than others, we can expect the distribution to be more unequal than 80/20. If the players are farmers, differences in skill may skew the distribution further. If they are products competing for customers, the better products may take over the market, but it does not always happen.

The simulation has shown the limitations of the conclusions drawn from a Pareto chart. When a product is a Runner, by definition it deserves a dedicated production line. That is a direct consequence of its being at the top of the chart. It does not, however, imply that it is “better” in any way than that the other products. The simulation arrived at a near 80/20 distribution of the chips without assuming any difference in the players’ ability to acquire chips: the roulette wheel has no favorites, and the players can do nothing to influence the outcome.

Share this:

  • Click to print (Opens in new window) Print
  • Click to share on Facebook (Opens in new window) Facebook
  • Click to share on LinkedIn (Opens in new window) LinkedIn
  • Click to share on Reddit (Opens in new window) Reddit
  • Click to share on X (Opens in new window) X
  • Click to email a link to a friend (Opens in new window) Email

Like this:

Like Loading...

By Michel Baudin • Technology • 4 • Tags: industrial engineering, Lean manufacturing, Management, Pareto

«< 162 163 164 165 166 >

Follow Blog via Email

Enter your email address to follow this blog and receive notifications of new posts by email.

Join 581 other subscribers

Recent Posts

  • Update on Data Science versus Statistics
  • How One-Piece Flow Improves Quality
  • Using Regression to Improve Quality | Part III — Validating Models
  • Rebuilding Manufacturing in France | Radu Demetrescoux
  • Using Regression to Improve Quality | Part II – Fitting Models

Categories

  • Announcements
  • Answers to reader questions
  • Asenta selection
  • Automation
  • Blog clippings
  • Blog reviews
  • Book reviews
  • Case studies
  • Data science
  • Deming
  • Events
  • History
  • Information Technology
  • Laws of nature
  • Management
  • Metrics
  • News
  • Organization structure
  • Personal communications
  • Policies
  • Polls
  • Press clippings
  • Quality
  • Technology
  • Tools
  • Training
  • Uncategorized
  • Van of Nerds
  • Web scrapings

Social links

  • Twitter
  • Facebook
  • Google+
  • LinkedIn

My tags

5S Automation Autonomation Cellular manufacturing Continuous improvement data science Deming ERP Ford Government Health care industrial engineering Industry 4.0 Information technology IT jidoka Kaizen Kanban Lean Lean assembly Lean Health Care Lean implementation Lean Logistics Lean management Lean manufacturing Logistics Management Manufacturing Manufacturing engineering Metrics Mistake-Proofing Poka-Yoke Quality Six Sigma SMED SPC Standard Work Strategy Supply Chain Management Takt time Toyota Toyota Production System TPS Training VSM

↑

© Michel Baudin's Blog 2025
Powered by WordPress • Themify WordPress Themes
%d