Michel Baudin's Blog
Ideas from manufacturing operations
  • Home
  • Home
  • About the author
  • Ask a question
  • Consulting
  • Courses
  • Leanix™ games
  • Sponsors
  • Meetup group
The-Most-Complicated-Formula

Feb 16 2012

Safety Stocks: Beware of Formulas

A formula you find in a book or learn in school is always tempting. It is a “standard.” If you follow it, others are less likely to challenge your results. These results, however, may be worthless unless you take a few precautions. Following are a few guidelines:

  1. Don’t use a formula you know nothing about. Its validity depends on assumptions that may or may not be satisfied. You don’t need to know how to prove the formula, but you need to know its range of applicability.
  2. Examine your data. Don’t just assume they meet the requirements. Examine their summary stats, check for the presence of outliers, generate histograms, scatter plots, time series, etc.
  3. Don’t make up missing data. If you are missing the data you need to estimate a parameter, find what you can infer about the situation from other parameters, by other methods. Do not plug in arbitrary values.
  4. Make your Excel formulas less prone to error by using named ranges rather than cell coordinates. If a formula is even slightly complicated, referring to variables by names like “mean” or “sigma” makes formulas easier to proof-read than with names like “AJ” or “AK.”

The safety stock formula for the reorder point method

Safety stock is a case in point. The literature gives you a formula that is supposed to allow you to set up reorder point loops with just the minimum amount of safety needed to prevent shortages under certain conditions of variability in both your consumption rate and your replenishment lead time. It is a beautiful application of 19th century mathematics but I have never seen it successfully used in manufacturing.

Let us look more closely at what it is so you can judge whether you would want to rely on it. Figure 1 shows you a model of the stock over time when you use the Reorder Point method and both consumption and replenishment lead time vary according to a normal distribution. The amount in stock when the reorder point is crossed should be just sufficient to cover your needs until the replenishment arrives. But since both replenishment lead time and demand vary, you need some safety stock to protect against shortages.

Figure 1. The reorder point inventory model

If your demand is the sum of small quantities from a large number of agents, such as sugar purchases by retail customers in a supermarket, then the demand model makes sense. In  a manufacturing context, there are many situations in which it doesn’t. If you produce in batches, then the demand for a component item will be lumpy: it will be either the quantity required for a batch or nothing. If you use heijunka, it will be so close to constant that you don’t need to worry about its variations.

What about replenishment lead times? If in-plant transportation is by forklifts dispatched like taxis, replenishment lead times cannot be  consistent. On the other hand, if it takes the form of periodic milk runs, then replenishment lead times are fixed at the milk run period or small multiples of it. With external suppliers, the replenishment lead times are much longer, and cannot be controlled as tightly as within the plant, and a safety stock is usually needed.

Let us assume that all the conditions shown in Figure 1 are met. Then there is a formula for calculating safety stock that you can find on Wikipedia or in David Simchi-Levy’s Designing and Managing the Supply Chain (pp. 53-54).  Remember that it is only valid for the Reorder Point method and that it is based on standard deviations of demand and lead time that are not accessible for future operations and rarely easy to estimate on past operations. The formula is as follows:

Where:

  • S is the safety stock you need.
  • C  is a coefficient set to guarantee that the probability of a stockout is small enough. You can think of it a number of standard deviations above the mean item demand needed to protect you against shortages. In terms of Excel built-in functions, C is given by:

C = NORMSINV(Service level)

Service levelC
90.0% 1.28
95.0% 1.64
99.0% 2.33
99.9% 3.09

  • The other factor, under the radical sign, is the corresponding standard deviation.
  • μL and σL are the mean and standard deviations of the lead time.
  • μD and σD are the mean and standard deviation of the demand per unit time, so that the demand for a period of length T has a mean of μD xT and a standard deviation of σDx √T

Case study: Misapplication of the safety stock formula

This formula is occasionally discussed in Manufacturing or Supply Chain Management discussion groups, but I have only ever seen one attempt to use it,  and it was a failure. It was for the supply of components to a factory, and 14 monthly values were available for demand, but only an average for lead times.

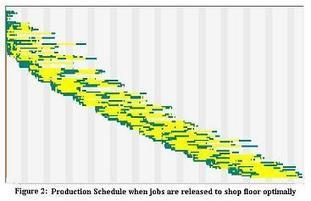
The first problem was the distribution of the demand, for which 14 monthly values were available. This is too few for a histogram, but you could plot their cumulative distribution and compare it with that of a normal distribution with the same mean and standard deviation, as in Figure 2. You can tell visually that the actual distribution is much more concentrated in the center than the normal model, which is anything but an obvious fit.  Ignoring such objections, the analyst proceeded to generate a spreadsheet.

Figure 2. Actual versus normal cumulative distribution

The second problem is that he entered the formula incorrectly, which was not easy to see, because of the way it was written in Excel.  The formula in the spreadsheet was as follows:

C*SQRT((AJ4*AL4^2)+(AI4^2*AM4^2))

then, looking at the spreadsheet columns, you found that they were used as follows:

  • AJ  for Standard Deviation of Daily Demand, and
  • AL for Average Replenishment time.

And therefore the first term under the square root sign was σDxμL2 instead of μLxσD2.

The third problem was that the formula requires estimates of standard deviations for both consumption and replenishment lead times, but no data was available on the latter. To make the formula produce numbers, the standard deviations of replenishment lead times was arbitrarily assumed to be 20% of the average.

For all of these reasons, the calculated safety stock values made no sense, but nobody noticed. They caused no shortage, and the “scientific” formula proved that they were the minimum prudent level to maintain.

Sizing safety stocks in practice

There is no universal formula to determine an optimal size of safety stocks. What can often be done is to simulate the operation of a particular replenishment loop under specified rules. For a simulation of a Kanban loop using Excel, see Lean Logistics, pp. 208-213.

No calculation or simulation, however, is a substitute for keeping an eye on what actually happens on the shop floor during production. One approach is to separate the safety stock physically from the regular, operational stock and monitor how often you have to dig into it. If, say, six months go by without you ever needing it, you are probably keeping too much and you cut it in half. With a Kanban loop, you tentatively remove a card from circulation. If no shortage results, then the card was unnecessary. If a shortage occurs, you return the card and look for an opportunity to improve the process so that the card can be removed.

Share this:

  • Click to print (Opens in new window) Print
  • Click to share on Facebook (Opens in new window) Facebook
  • Click to share on LinkedIn (Opens in new window) LinkedIn
  • Click to share on Reddit (Opens in new window) Reddit
  • Click to share on X (Opens in new window) X
  • Click to email a link to a friend (Opens in new window) Email

Like this:

Like Loading...

By Michel Baudin • Technology • 38 • Tags: Kanban, Logistics, Reorder point, Visual management

Feb 10 2012

Improvement example: undercoating at Collins Bus

Via Scoop.it – lean manufacturing

In Lean, paying attention to shop floor details is a strategy, a point that is often lost in “high-level” discussions. This story is a concrete kaizen case study and a good reminder: it is about eliminating overspray and time lost changing drums of coating material.
Via www.reliableplant.com

Share this:

  • Click to print (Opens in new window) Print
  • Click to share on Facebook (Opens in new window) Facebook
  • Click to share on LinkedIn (Opens in new window) LinkedIn
  • Click to share on Reddit (Opens in new window) Reddit
  • Click to share on X (Opens in new window) X
  • Click to email a link to a friend (Opens in new window) Email

Like this:

Like Loading...

By Michel Baudin • Press clippings • 1 • Tags: Kaizen, Lean, Manufacturing engineering

Feb 8 2012

The Original Kanbans

Via Scoop.it – lean manufacturing

The kanban has met many adventureson its way to becoming a popular tool for the limitation of tasks, projects and works in process. As superhero origin stories go, kanban has an interesting one. As long ago as 8th century Japan, guidelines were set down for the forms and functions of kanban as corporate logos and shop signs. Just as the study of the use and evolution of forms of kanban as an improvement tool is illustrative as to the development of management various industries from manufacturing to software development, an examination of kanban as Japanese shop signs is instructive of the historical and cultural changes that took place.
Read more: Lean Manufacturing Blog, Kaizen Articles and Advice | Gemba Panta Rei
Via www.gembapantarei.com

Share this:

  • Click to print (Opens in new window) Print
  • Click to share on Facebook (Opens in new window) Facebook
  • Click to share on LinkedIn (Opens in new window) LinkedIn
  • Click to share on Reddit (Opens in new window) Reddit
  • Click to share on X (Opens in new window) X
  • Click to email a link to a friend (Opens in new window) Email

Like this:

Like Loading...

By Michel Baudin • History • 1 • Tags: Kanban

Feb 8 2012

Graphic representation of a Lean schedule

Via Scoop.it – lean manufacturing

A clever graphic tool. According to the author, Prasad Velaga, the schedule was actually generated by finite capacity scheduling logic from a real test dataset that was taken from a job shop.
Via optisol.biz

Share this:

  • Click to print (Opens in new window) Print
  • Click to share on Facebook (Opens in new window) Facebook
  • Click to share on LinkedIn (Opens in new window) LinkedIn
  • Click to share on Reddit (Opens in new window) Reddit
  • Click to share on X (Opens in new window) X
  • Click to email a link to a friend (Opens in new window) Email

Like this:

Like Loading...

By Michel Baudin • Technology • 6 • Tags: Production control, Visual management

TaktTimesHomepageLogo

Feb 7 2012

Takt times and falling sales: How to Respond?

Question from Jean-Baptiste Bouthillon on The Lean Edge:

We have all learned that overproduction is muda, and that production must follow the takt of customer demand.
Is there a lean way of dealing with falling sales ? Should we just adjust production to customer takt time or stabilize sales by giving rebates ?
Is it important to level sales and give some stability to production or should we just adjust the production takt time ?

My response:

You question implies that takt time is only a function of customer demand. It is not. When you calculate it, you divide your production time by the demand, which means that it is as much a function of how long you decide to work as of how much you have to produce. Without any change in customer demand, you double the takt time by working two shifts instead of one.

The takt time of a production line is the time that elapses between two consecutive unit completions when the line runs. It is not the rate at which customer orders arrive.

So how do you respond to falling sales?

You have to distinguish between fluctuations in sales, for which you should not change the pace of production, and major changes, for which you should.

Once you have set up a large assembly line to work at a takt time of 57 seconds, changing it to 60 seconds is a major effort, involving the balancing of tasks among stations and adjustments in part supplies. In car assembly, unless you are hit by something like the Fukushima earthquake, you don’t do it more than once in four months, even if you are Toyota. During this period, you use heijunka to respond to fluctuations in mix, and adjust overtime for fluctuations in total volume.

If you have a major downturn, you have to reduce production, and the challenge then is to do it without going bankrupt while retaining the work force you spent so much time and effort developing.
It is in such times that having your money tied up in inventory can bankrupt you. When the recession hit in 2008, management in manufacturing companies suddenly took an interest in working capital, but it was too late. Downturns come brutally, and it is when they occur that you must be ready.

Keeping your work force intact and prepared for the next upturn is just as essential. So you stop using temps, cut all overtime, go on four-day weeks, or three-day weeks, and use the available time to solve nagging engineering problems, experiment with new technology, etc. I remember an auto parts plant in Japan, in which recession time had been used by a team to build in-house a pick-to-light system with their own AGV out of Creform. Even though they did not explain it, you could tell that they would know exactly what to require from vendors and how to deploy this technology when the upturn came.

Share this:

  • Click to print (Opens in new window) Print
  • Click to share on Facebook (Opens in new window) Facebook
  • Click to share on LinkedIn (Opens in new window) LinkedIn
  • Click to share on Reddit (Opens in new window) Reddit
  • Click to share on X (Opens in new window) X
  • Click to email a link to a friend (Opens in new window) Email

Like this:

Like Loading...

By Michel Baudin • Technology • 9 • Tags: Lean assembly, Lean Logistics, Lean manufacturing, Takt

NIST MEP logo

Feb 5 2012

Should Governments Subsidize Manufacturing Consultants?

Since 1988, the federal government of the United States has been subsidizing consulting firms through a program called Manufacturing Extension Partnership (MEP) out of the National Institute of Standards and Technology (NIST). The MEP has existed through five presidencies of both parties and now supports 1,300 consultants who provide cut-rate services to small and medium-size manufacturing companies, effectively shutting out other consultants from this market segment.

This raises the question of what qualifies an agency set up to calibrate measurement instruments to pick winners among consultants in areas like technology acceleration, supplier development, sustainability, workforce and continuous improvement. Clearly, the leaders of the MEP must have an extensive experience of manufacturing to make such calls.

Director Roger Kilmer just posted an article entitled A Blueprint for America: American Manufacturing on the NIST MEP blog. According to his official biography, the director of the MEP has been with NIST since 1974 and has never worked in manufacturing. On the same page, you can see that some members of the MEP management team have logged a few years in the private sector, in electric utilities, nuclear power, and IT services. None mention anything like 20 years in auto parts or frozen foods.

Roger Kilmer

I agree with Roger Kilmer that manufacturing is essential to the growth of the U.S. economy, and even that government should help. All over the world, particularly at the local level, governments provide all sorts of incentives for companies to build plants in their jurisdiction. But is it proper for a government to directly subsidize service providers? The alternative is that whatever help is given go directly to manufacturing companies, for them to pay market rates for services from providers they choose.

Christine Lagarde

In addition, the most effective help is not necessarily a subsidy. Hearing the CEO of a small, French manufacturing company uncharacteristically praise then finance minister Christine Lagarde, I asked what she had done to deserve it. “In 2009,” he said, “banks were denying credit to everybody. We were going bust. She decreed that bankers had to explain why for each case to her ministry. That was enough to pry the money loose.” It was done with a light touch, didn’t cost any money, and worked.

Share this:

  • Click to print (Opens in new window) Print
  • Click to share on Facebook (Opens in new window) Facebook
  • Click to share on LinkedIn (Opens in new window) LinkedIn
  • Click to share on Reddit (Opens in new window) Reddit
  • Click to share on X (Opens in new window) X
  • Click to email a link to a friend (Opens in new window) Email

Like this:

Like Loading...

By Michel Baudin • Management • 3 • Tags: Government, Management, Manufactuting

«< 142 143 144 145 146 >»

Follow Blog via Email

Enter your email address to follow this blog and receive notifications of new posts by email.

Join 581 other subscribers

Recent Posts

  • Update on Data Science versus Statistics
  • How One-Piece Flow Improves Quality
  • Using Regression to Improve Quality | Part III — Validating Models
  • Rebuilding Manufacturing in France | Radu Demetrescoux
  • Using Regression to Improve Quality | Part II – Fitting Models

Categories

  • Announcements
  • Answers to reader questions
  • Asenta selection
  • Automation
  • Blog clippings
  • Blog reviews
  • Book reviews
  • Case studies
  • Data science
  • Deming
  • Events
  • History
  • Information Technology
  • Laws of nature
  • Management
  • Metrics
  • News
  • Organization structure
  • Personal communications
  • Policies
  • Polls
  • Press clippings
  • Quality
  • Technology
  • Tools
  • Training
  • Uncategorized
  • Van of Nerds
  • Web scrapings

Social links

  • Twitter
  • Facebook
  • Google+
  • LinkedIn

My tags

5S Automation Autonomation Cellular manufacturing Continuous improvement data science Deming ERP Ford Government Health care industrial engineering Industry 4.0 Information technology IT jidoka Kaizen Kanban Lean Lean assembly Lean Health Care Lean implementation Lean Logistics Lean management Lean manufacturing Logistics Management Manufacturing Manufacturing engineering Metrics Mistake-Proofing Poka-Yoke Quality Six Sigma SMED SPC Standard Work Strategy Supply Chain Management Takt time Toyota Toyota Production System TPS Training VSM

↑

© Michel Baudin's Blog 2025
Powered by WordPress • Themify WordPress Themes
%d