May 17 2012
How An Aeron Chair Gets Built Every 17 Seconds
See on Scoop.it – lean manufacturing

Cliff Kuang:
Amidst all the doom-and-gloom about the death of American manufacturing, the one, simple fact that’s usually forgotten is that we’re still the world’s No. 1 manufacturer. No joke, and not a typo: We produce one fifth of the world’s total manufacturing output.
The difference between how Americans once made stuff and how that stuff is made today is that manufacturing in the U.S. has reached a stunning level of efficiency that can be hard to really comprehend. Unless, of course, you visit a factory like the one that makes Herman Miller’s Aeron chair. We recently did, and saw a process which has yielded a 500% increase in productivity and a 1,000% increase in quality since 1998…
See on www.fastcodesign.com

May 17 2012
Tesla Motors revives NUMMI plant in Fremont, CA
See on Scoop.it – lean manufacturing
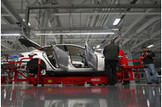
An article on how Tesla is reviving the shuttered NUMMI plant in Fremont, CA, with a production line designed by Toyota Alumnus Gilbert Passin.
See on www.bloomberg.com
Share this:
Like this:
By Michel Baudin • Press clippings 4 • Tags: Lean assembly, Lean manufacturing, Toyota, Toyota Production System