Jul 10 2012
Photos of SSJ 100 Nose and Rear Production – English Russia
See on Scoop.it – lean manufacturing
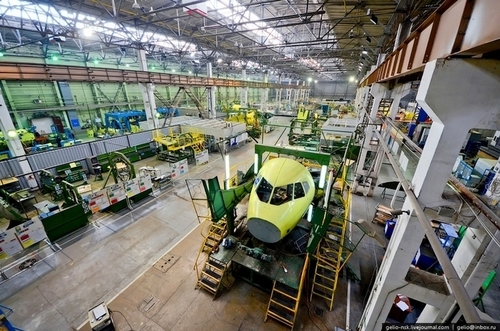
The Chkalov factory makes nose and rear sections for the Superjet 100, Sukhoi’s entry in the regional jet market, in competition with Embraer and Bombardier. While praised for its design, the Superjet 100 has been late in ramping up production and its future is in jeopardy following a crash during a demonstration in Indonesia on May 9, 2012.
According to the article, the plant has a Lean program in place. Based on the photographs, the manufacturing concept is fixed-station assembly with kitting.
See on englishrussia.com


Jul 10 2012
Airbus Starts Production Of The A320neo Family | IFExpress
See on Scoop.it – lean manufacturing
Moving assembly line for pylons at Airbus St. Eloi
See on airfax.com
See photos of the pylon assembly line, with comments in French, in a dossier from L’Usine Nouvelle.
Share this:
Like this:
By Michel Baudin • Press clippings 0 • Tags: Aerospace, Lean manufacturing