Aug 29 2021
Distributed Teams Can Work After All
The 2012 paper in Science about the CRISPR/Cas9 system has been hailed as the greatest breakthrough in biology since Crick and Watson’s discovery of the DNA double helix in 1953. It has earned its two Principal Investigators (PI), Emmanuelle Charpentier and Jennifer Doudna, the 2020 Nobel prize in chemistry. Laypersons cannot really follow this paper but what we can better understand is how the research team worked. And it is remarkable.


Oct 8 2021
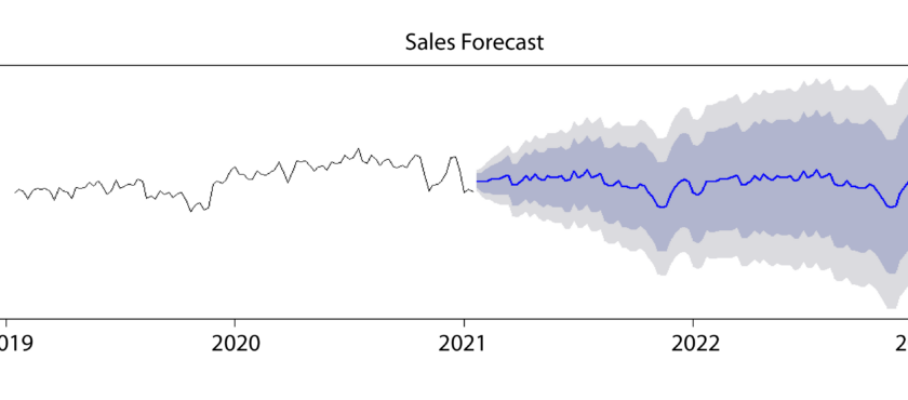
Sales Forecasts – Part 4. Generating Point Forecasts with Trends and Seasonality
This fourth post about sales forecasts addresses what you actually start with — that is, visualizing the time series of historical sales and generating point estimates for the future. Theyou analyze the residuals to determine the probability forecasts.
What prompted me to review this field is the realization based on news of the M5 forecasting competition that this field has been the object of intense developments in recent years. Some techniques from earlier decades are now accessible through open-source software that can crunch tens of thousands of data points on an ordinary office laptop.
Others are new developments. Thanks to Stefan de Kok, John Darlington, Nicolas Vandeput, and Bill Waddell for comments and questions on the previous posts, that made me dig deeper:
Contents
Share this:
Like this:
By Michel Baudin • Tools 0 • Tags: Exponential Smoothing, Holt-Winters, Point Forecast, Probability Forecast, Sales Forecasting, Time Series