Jul 16 2021
Sales Forecasts – Part 1. Evaluation
When sizing a new factory or production line, or when setting work hours for the next three months, most manufacturers have no choice but to rely on sales forecasts as a basis for decisions.
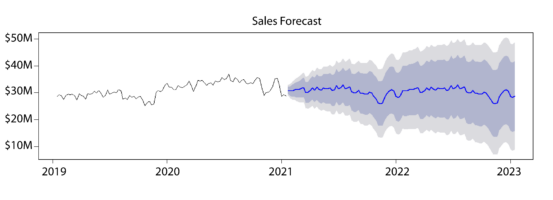
But how far can you trust sales forecasts? You use a training set of data to fit a particular model and a testing set of actual data observed over a time horizon of interest following the end of the training set period. The training set may, for example, cover 5 years of data about product sales up to June 30, 2021, and the testing set the actual sales in July, 2021.
The forecasters’ first concern is to establish how well a method works on the testing set so that the decision makers can rely on it for the future. For this, they need metrics that reflect end results and that end-users of forecasts can understand. You cannot assume that they are up to speed or interested in forecasting technology.
Forecasters also need to compare the performance of different algorithms and to monitor the progress of an algorithm as it “learns,” and only they need to understand the metrics they use for this purpose.
Contents
Sales Forecasting in the Literature
The most current source is M5 forecasting competition of 2020. The challenge was a sales forecast of the sales by Walmart of 3,049 products in 10 stores for 28 days based on a 5.5-year history of daily sales supplemented by external variables including, for example, special days, weather events, and promotions. Out of ~20,000 candidates, the winner was LightGBM, “a gradient boosting framework that uses tree based learning algorithms.”
Otherwise, a literature search for “sales forecasts” yields few titles on this exact subject, and many more on forecasting in general. They cover topics like call volumes at a call center, the weather, and securities prices. Sales in general, and in particular the demand for manufactured goods, is not covered extensively. The message of the few authors that cover this subject in either discouraging or, compared to M5, outdated.
Writing in 2002, Tom Wallace tells you not to focus on sales forecast accuracy, presumably because it’s a hopeless pursuit. The other references, up to 2019 cover 1970s vintage methods and some accuracy metrics but not methods to predict quantiles or prediction intervals directly from the data.
In their defense, more recent developments failed to outperform these methods until the M4 competition in 2018. They do now, as M5 confirmed.
Forecast Performance for End-Users
For each element of the testing set, the residual is the difference between the actual value y and the forecast \bar{y} and the ratio
s = \frac{\left |y-\bar{y}\right |}{y}
expressed as a percentage, is a measure of the forecast’s accuracy that everyone understands, as in, “the sales forecast is within ±5% of the actual.”
By specifying a list of thresholds, like 5%, 10%, 15%, 20%, 30%, you can tally the number of forecasts in the testing set that are within ±5%, ±10%, ±15%, ±20%, and ±30% of the actual, as a proportion of the size of the testing set. This gives you a “Proportional Estimation Accuracy Table” (PEAT).
It usually makes sense to slice and dice the testing set in a variety of ways. Each data point in the testing set is for a given product on a given day.
As you can expect sales forecasts to be more accurate 1 day than 30 days ahead, you can generate a different table for each day. As you can also expect forecasts for Runners to be more accurate than for Repeaters or Strangers, you can generate a table for each category,…
Without knowing anything about algorithms, the production control manager will know what to do with the information that sales forecasts for Runners are within ±5% of actuals one week ahead 90% of the time and that this goes down to ±15% when you look ahead one month. The same manager may also conclude that the forecasts for Strangers are useless.
Sales Forecast Performance for Forecasters
In 2021, practicing forecasters do not need to code their own algorithms or explain the underlying math. They buy and use them as a service, or download them. They need to understand them as a driver understands a car but not as a mechanic or a designer. It includes purpose, input requirements, and outputs but not the math.
It calls for more summarized and more abstract metrics of performance, that may not be of interest to the end-users.
Every forecast error leads to wrong decisions, and therefore to losses. An overall assessment of a forecasting tool can therefore be described as some measure of the losses errors generate.
A complete assessment of these economic losses would be complex and not necessarily mathematically tractable. For these reasons, much simpler loss functions are actually used.
The Metrics Used In The M5 Forecasting Competition
We describe here step by step the construction of the two main metrics used in M5. Once unpacked, they are easier to understand as their names might suggest:
- The “Weighted Root Mean Square Scaled Error” (WRMSSE) of sales forecasting accuracy for a family of products.
- The “Weighted Scaled Pinball Loss” (WSPL) for the bracketing of the values in terms of quantiles and confidence intervals.
Among candidates, the algorithm that performs best in terms of WRMSSE does not necessarily excel in WSPL, and vice versa.
Open-source Python and R software is available to calculate both WRMSSE and WSPL, and the following explanations are about their meaning. They are not intended as guides to coding.
The “Weighted Root Mean Square Scaled Error” (WRMSSE)
The WRMSSE is the quadratic loss function that is implicitly used whenever a model is fitted using least squares. As it starts out flat at 0, It inflicts small losses for small errors, rising quadratically with the errors. It is usually suitable in sales forecasting for manufacturing products, where small errors are relatively harmless but large ones crippling.
By contrast, sometimes you need to hit a target and your loss is the same whether you miss by an inch or a mile. In those cases, you use the 0-1 loss function and maximum likelihood estimators. In quality, classical tolerancing classifies a part as within specs or out of specs, which means it uses the 0-1 loss function. Taguchi replaced it with the quadratic loss function.

The Root Mean Square Error (RMSE)
The most common being the mean of the squared error. If the testing set has h points, the actual values are y_1,...,y_h and the forecasts \bar{y}_1,...,\bar{y}_h, then the Mean Squared Error (MSE) is
L^2= \frac{1}{h}\times \sum_{i=1}^{h} \left ( y_i - \bar{y}_1 \right )^2
The summary is usually expressed as L or Root Mean Squared Error (RMSE) to match the dimension as the y_i.
For the same reason, you use the standard deviation \sigma rather than the variance \sigma^2 of a random variable: the interval \mu \pm n\sigma around the mean \mu makes sense.
The Root Mean Square Scaled Error (RMSSE)
The RMSE, however, is affected by the scale of the variability of the y_i, not just the quality of the forecast. To eliminate this, you compare L instead to the RMSE of the naive one-step forecast \bar{y}_{i+1} = y_i in which the demand for period i+1 is assumed to match the consumption of period i. This is implicitly used in the Kanban system. If the training set has n points, the RMSE S of the naive forecast is
S^2= \frac{1}{n-1}\times \sum_{i=2}^{n} \left ( y_i - y_{i-1} \right )^2
The ratio T = L/S then measures how much better the forecasting algorithm is than the naive forecast when the loss function is quadratic. We call this ratio the Root Mean Squared Scaled Error (RMSSE).
The Weighted Root Mean Square Scaled Error (WRMSSE)
When you are forecasting sales more than one product, you can compute an RMSSE for each. It gives you a vector of assessments but not a single assessment for the whole family. Unless forecast errors have equivalent consequences for all products, taking a straight average of the RMSSEs does not make sense. For example, you want to give the RMSSE of a Runner more weight than that of a Stranger.
But how do you assign a weight to a product? In retail, you can use recent sales, in monetary terms. In manufacturing, it is more complex. Loss leaders, for example, may tie up as many resources as the high margin items. In machine-based operations, it may make more sense to assign a weight based on recent consumption of a bottleneck; in manual operations, you could use labor requirements. Regardless of which weight you use, if w_p is the weight you assign to product p in the family P of products, and T_p is its RMSSE, then the WRMSSE of the entire product family is:
U\left ( P \right ) = \sum_{p\in P}^{} w_p\times T_p
The Weighted Scaled Pinball Loss (WSPL)
Besides producing numbers for daily demand by product, the forecaster wants to provide a confidence interval. Traditionally, this is based on an analysis of the residuals y_i - \bar{y}_i in the training set that assumes them to be a white noise.
More sophisticated methods to forecast quantiles directly from the raw data have emerged in the past 10 years. They are available as black boxes. Again, forecasters don’t need to know their inner workings but they do need to measure how well they work. The Weighted Scaled Pinball Loss (WSPL) is the metric used for this in M5.
The Pinball Loss Function
The the pinball loss function is used when the objective of the forecast is a quantile of the distribution. The forecast output, for example, may be a level that 80% of the future values will fall below, or above. The name comes from the graphic shape of the loss function. It bounces like a pinball off the x-axis where actual values exactly match the forecast quantile:

If the pinball function is
\varrho_\tau\left ( y \right ) = y\left ( \tau - I_{\left [ y\leq 0\right ]}\right )
where I_{\left [ y\leq 0\right ]} is the indicator function, worth 1 when y\leq 0 and 0 otherwise.
The Pinball Loss L_{\tau}\left ( y,z \right ) for actual value y and \tau-quantile forecast z is then:
L_{\tau}\left ( y,z \right ) = \varrho_\tau\left ( y -z\right )
While this is by no means obvious, according to Biau and Patra, the true \tau-quantile minimizes the expected value of the pinball loss.
Those who remember calculus can see it when a random variable Y has a probability distribution function f\left ( y \right ) and a cumulative distribution function F\left ( y \right ) because
E\left (L_{\tau}\left ( Y,q \right ) \right ) = E\left ( \varrho_\tau\left ( Y -q\right ) \right ) =\int_{-\infty}^{+\infty}\left (y -q \right )\left ( \tau - I_{\left [ y \leq q\right ]}\right )f\left ( y \right )dy
Knowing that the derivative of the indicator I_{\left [ y \leq q\right ]} is the Dirac \delta_q, we have:
\frac{\partial }{\partial q}E\left (L_{\tau}\left ( Y,q \right ) \right )= -\tau + F\left ( q \right )
which zeroes at q = F^{-1}\left ( \tau \right ) and \frac{\partial^2 }{\partial q^2}E\left (L_{\tau}\left ( Y,q \right ) \right ) = f\left ( q \right ) \geq 0, which says that E\left (L_{\tau}\left ( Y,q \right ) \right ) has a minimum where q is the \tau-quantile of the distribution.
Therefore, among different quantile forecasting algorithms, it makes sense to select the one with the smallest pinball loss.
The Scaled Pinball Loss (SPL) for one product
For this metric, the scaling factor is also based on the naive forecast on the training set. It uses absolute values rather than squares, for consistency with the Pinball Loss function in the numerator:
S = \frac{1}{n-1}\times \sum_{i=2}^{n}\left |y_i - y_{i-1} \right |
And the Scaled Pinball Loss Function for the testing set is:
T_{\tau} = \frac{1}{h}\sum_{i=1}^{h}\frac{L_{\tau}\left ( y_i, z_i \right )}{S}
The Weighted Scaled Pinball Loss Function (WSPL)
The weights of the different series are the same as for the WRMSSE calculations, and, therefore, for the family P of products,
U_\tau\left ( P \right ) = \sum_{p\in P}^{} w_p\times T_{\tau}
References
- Makridakis, S., Spiliotis, E. & Assimakopoulos, V. (2021) The M5 competition: Background, organization and implementation
- Wiseman, P.K. (2019)Sales Forecasting: Process and Methodology in Practice, CreateSpace Independent Publishing Platform, ISBN: 978-1719012652
- Carlberg, C. (2016) Excel Sales Forecasting For Dummies, 2nd Edition, For Dummies, ISBN: 978-1119291428
- Kolassa, S., Siemsen, E. (2016) Demand Forecasting for Managers, Business Expert Press, ISBN: 9781606495032
- Thomopoulos, N. T. (2014)Demand Forecasting for Inventory Control. Germany: Springer International Publishing, ISBN: 9783319119762
- Biau, G. & Patra, B. (2011) Sequential Quantile Prediction of Time Series
- Bourdonnais, R. & Usunier. J.C. (2007) Prévision des Ventes, Economica, ISBN: 978-2-7178-5344-8
- Wallace, T. & Stahl, R. (2002) Sales Forecasting, T.F. Wallace and Company, ISBN: 096748841-9
- Phadke, M. (1989) Quality Engineering Using Robust Design, Prentice Hall, ISBN: 0-13-745167-9
#salesforecast, #productionplanning, #kanban, #M5Competition
July 22, 2021 @ 2:23 pm
Interesting blog. I have a lot of criticism though. And a dire warning.
My criticism is mostly not on the blog itself. It merely reports on concepts and does not make judgments. But in this case, maybe it should have. The metric choices made in M5 were very poor. And there is a real risk others will use the M5 as example and make the same mistakes.
All two M5 metrics discussed are poor choices.
The first, WRMSSE, is not fundamentally a problem. My only critique on this one is that it favors methods that overfit metrics and the weights and scaling should be chosen carefully. Something M5 did not do. Resulting in a huge disadvantage to traditional statistical methods, since many AI methods very strongly target the provided metric. If the metric is not perfectly aligned with business value, AI results will be equally misaligned with business value. For the purposes of M5 deterministic track WRMSSE, a pure verdict on inherent forecast quality may have been correct. But do not use it in business and expect the best business results.
The second, WSPL, is utterly useless. It is the most gameable metric in existence. This means you can make the forecast worse whilst making the metric results look better, and do so purposely. Using very simple rules you can make the results dramatically better than the correct values. You can verify this claim for yourself by simply generating a large number of random values (any distribution will do) and measure pinball loss against the exact distribution that you used to generated them. You can do this in Excel for example. Then start rounding down all percentile quantities below the median and rounding up all percentile quantities above the median. You will notice a nice improvement of the metric. But don’t stop there, you can further decrease below the median and increase above the median and the results will get ever better. As you make the forecast less precise the pinball loss function will think you are making the forecast better. This way you can make the metric more than 12x better!
Again, AI, which overfits metrics, abuses this. Whilst the M5 competition concluded that LGB algorithm (which had most top 50 results including the winner) was the most accurate, the correct conclusion should have been that LGB targets the metric better than any other method.
It is very unfortunate that the metric chosen was the worst possible choice in this regard. Everything else about M5 was amazing. The data was near perfect. For a perfect M6, all they need to do is add historical inventory data and choose viable metrics and it will be perfect…
July 22, 2021 @ 3:07 pm
To me, overfitting is using a model with too many parameters, that fits closely to the training data but has no predictive value on the testing set.
The metric is the tool you use to assess the fit. What does it mean to overfit a metric?
Looking at TPE, I find the idea simple and attractive. As I understand it, for each point in the testing set you partition the range of its forecast distribution into a sequence of “quantile bins” of equal probabilities and assign the actual value to its bin sequence number.
You then aggregate the bins over the entire testing set and count the number of actual values in each bin. The expected counts in all bins are then all equal. So far, I am with you.
Then you count the excesses and shortfalls in each bin as an error and, with scaling and weighing, aggregate these errors over all the bins to get the TPE.
As I see it, however, with all the distributions fitting perfectly, the vector of bin counts is a random variable following the multinomial distribution, with all the n bins having the same probability p = 1/n. In statistical testing, this would be the null hypothesis.
It means that the TPE is not sufficient to rank forecasting methods.
We can test the bin counts against this null hypothesis and calculate a p-value for each method. Perhaps these p-values could be used to rank them, with the method that provides the most evidence against the null hypothesis being the worst. What do you think?
July 24, 2021 @ 8:08 am
Michel, the case you describe is when the bins are all equal size, and you are correct up to the paragraph of distribution. It does extend to cases where the bin sizes are not equal (such as standard TPE, where bin sizes follow standard deviation values of a normal distribution).
But sticking with the simpler case of equal bin sizes, the distribution that results will be uniform, not multinomial. We are counting, not summing. Compare this to throwing a die multiple times if you throw it 600 times you still expect to throw roughly an equal number of each value. 100 1’s, 100 2’s, etc. If you applied multinomial it would say you would throw a handful of 1’s and over 200 3’s. Not correct.
One way to see the equal bin size flavor of TPE is as an extension of the Probability Integral Transform (PIT) (https://en.wikipedia.org/wiki/Probability_integral_transform)
The main difference that PIT is generally applied multiple times to the same distribution, whilst TPE is applied to different distributions. Since they all convert to uniform distribution, we can count the totals after transform just like is done with PIT. Non-equal bin size then further distances TPE from PIT, but the concept stays the same.
July 24, 2021 @ 11:07 am
The Multinomial Distribution is a model you often use when counting items in bins, and bins with equal probabilities are just the special case that maximizes entropy. It’s also called “discrete uniform distribution,” but it’s still multinomial.
I prefer the bins with equal probabilities over anything based on σ because it’s more distribution-free. I actually can’t think of any restriction this puts on the distributions.
Not all distributions have σ’s, and such moments aren’t necessarily informative on those that do. For example, what does the σ of a bimodal distribution tell you?
July 26, 2021 @ 6:34 am
Indeed there are some distributions, such as bimodal ones, where any non-uniform bin sizing with center of mass around the median is not helpful. Then again, even the median and mean are not helpful for such distributions. Thankfully we only see those in supply chains in cases where probability distributions should not be applied or those that are reducible to unimodal ones. An example of the first, constrained demand or inventory positions. Example of the second, when you sum two demand streams together that are on different scales they will seem bimodal, but when you look at them separately they are not.
July 29, 2021 @ 9:24 am
Sorry, I was confused. I just realized that using gaussian σ’s as a basis for binning the actual values places no more constraints on the forecast distribution than using equal probability bins.
July 24, 2021 @ 8:34 am
With regards to overfitting.
Any data with more measurements than degrees of freedom (i.e. parameters) can be overfitted. In time-series if you fit a 2-parameter curve through 12 points, you are likely to overfit. This kind of overfitting is well-known (the most well-known problem with statistical forecasting). But it is not the only kind of overfitting.
In statistical forecasting methods are often chosen because they target a certain (simple) metric well. For example, it is known that absolute errors metrics are minimized with methods targeting the median, and squared error metrics are minimized with methods targeting the mean of the residual distribution.
BUT these methods do not explicitly target those metrics. They were just chosen because they happen to be best for the (simple) metric of choice. If you compare that to many AI methods, the data scientist will generally not pick a method because it is good for a metric. Instead, they will feed the metric into the method and let it artificially decide how to optimize the metric result values. Now the metric itself can be overfitted. Something that never occurred to statisticians because they never encountered it.
Overfitting a metric can be good or bad. A nicer way of expressing it may be that a method has a certain strength in targeting metrics. If a metric can be found that correlates strongly with business value, targeting it will be beneficial. However, the vast majority of metrics used in practice are academic, with little to no correlation to business value. (WRMSSE and WSPL are prime examples). If you target those metrics it will damage the business.
So now that we are mixing data science and statistics we need to be careful of the pitfalls of both domains. AI tends to be a much more powerful tool than statistical forecasting and with far less transparency, and its errors tend to be much graver and much more devious as a result.
July 24, 2021 @ 11:27 am
What I don’t understand is what overfitting a metric means. How do you do it? How do I detect it? I find it particularly confusing when you say that it can be “good or bad.” How can something called “overfitting” ever be good?
Statistics, now, is a subset of data science, not something to be mixed with it.
“AI” is now often taken to mean deep learning, which has nothing to do with what we would call “deep learning” in any other context. It’s unsupervised methods like deep learning that are opaque. I would only recommend them for cases where it doesn’t matter, like handwriting recognition. You don’t care how the software recognizes handwriting, as long as it does. In sales forecasting, transparency matters.
Methods like MARS, bagging, or random forests are no less transparent than older statistical tools.
July 26, 2021 @ 7:27 am
Probably I should have reversed my statement. NOT overfitting a metric can also be stated as strength in targeting a metric, BUT strength in a metric can be sometimes be seen as overfitting. I call it overfitting purposely to highlight the risks, but it may not always be the case.
Overfitting indeed generally has a negative meaning in that it describes that patterns that have a tight fit in a training set have a poor fit in the test set. In time-series forecasting this means a strong fit to history but poor predictive value. In case of metrics I see it as a strong fit to the metric, but not predictive of real world value.
The only two way I’ve detected that is correlate the metric improvement against various aspects of business value (e.g. stock outs, lost sales or rush orders). Then compare those correlations with those of the same metric, but a simple forecast method was used. This is definitely doing things the hard way. The only reason I could do this is because I did it in benchmarks that were already happening. The data and prior correlations were already available. The sheer magnitude of effort would prevent me from doing it any other way since this is not in scope of any projects I typically participate in. But I have searched and found mentions of the same in literature in the past.
I agree on the naming issues. In practice though, statisticians and data scientist have very little overlap in skillsets and experiences. Mostly just the basics.
Blackbox is generally fine in sales forecasting. As long as you can visualize it clearly and it outperforms any alternative people will learn to trust it. In my experience, generally within 3 months. Like trusting my modern car more than my old clunker. I know exactly what happened under the hood of the clunker, but even the mechanic needs to plug in a computer to tell what is going on with the modern car. I think my life is more important than getting a sales forecast right, yet I trust the blackbox with it.
Just like a car, the driver still needs to act and can be judged for their action. If the driver claims after an accident the brakes did not work that needs to be verifiable. The same is needed in sales forecasting. It does not need to be transparent, but it does need to be explainable, and reproducible. If the forecaster says “but the model said demand would go up 200% if I ran this promotion” then you need to be able to go back and either see it in the archive or simulate it again with equal outcome.
July 22, 2021 @ 4:19 pm
There is a very simple principle when it comes to forecasting. Is the customer willing to wait as long as it takes to make the good? If not, you must forecast. Any assertion that you shouldn’t forecast because it is hard or inaccurate ignores this principle at his own peril.
One of the more pressing problems with forecasting is the use of point forecasts. This is not much better than no forecast because demand uncertainty gives the producer a decision to make. How much demand, of all possible scenarios, should I plan to fulfill? This where sales forecasting intersects well with production planning.
Evaluating Sales Forecasts — Part II – E-learning for Everyone
July 30, 2021 @ 1:34 pm
[…] accuracy metric for probability forecasts that Stefan de Kok recommends as an alternative to the WSPL. Finally, I summarize a few points raised in discussions on LinkedIn and in this […]