Feb 8 2012
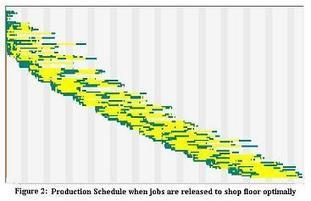
Graphic representation of a Lean schedule
Via Scoop.it – lean manufacturing
A clever graphic tool. According to the author, Prasad Velaga, the schedule was actually generated by finite capacity scheduling logic from a real test dataset that was taken from a job shop.
Via optisol.biz

February 12, 2012 @ 9:13 am
Comment in the NWLEAN discussion group on Yahoo!
February 12, 2012 @ 9:15 am
The point of using caps on WIP to control production in a job-shop is that you don’t need all the detailed measurements for all routes to make it work. In fact, it works even in service situations where the service time for each customer at each operation varies randomly. I have seen it used successfully in an R&D lab developing a semiconductor process and where every job was an experiment on one or more operations within the process.
It is Little’s Law at work. Starting from an empty shop, if you release more and more jobs, at first the output increases. Once the shop is saturated, output plateaus and while WIP rise and lead time rise. By capping the WIP at a level that you determine by trial and error, you can set the output rate at the level you want without making the WIP explode, regardless of how the flow is managed inside the shop.
In a job-shop, each job’s route is planned individually and printed as a traveler, that stays with the job and lets every operator know where the job should go next. What I usually recommend is to process the jobs on a FIFO basis at every operation on their routes. Since the WIP caps keep the overall lead time low anyway, there is not much to be gained by playing
scheduling games inside the shop.
Of course, if you cap the WIP, you cause jobs to wait before release, but the only thing that actually waits is the traveler. It is when you release the job to production that the traveler mates with materials, tools, fixtures, jigs, programs, etc. and the consequences of messing with it reach much farther.
Of course, this method is not appropriate in a shop with high-volume products or product families going through fixed routes, but then the data you need exists and is much smaller than in a job-shop. In an aerospace or automotive machine shop, the WIP cap method would be applicable in the tool room where you make custom fixtures but not on the main floor where you machine parts repetitively in cells.
February 19, 2012 @ 5:38 am
Comment in the NWLEAN discussion group on Yahoo!
February 19, 2012 @ 5:39 am
Comment in the NWLEAN discussion group on Yahoo!
February 19, 2012 @ 5:52 am
@Prasad – On Wed, 15 Feb 2012 16:07:40, you wrote:
> … WIP capping plus FIFO rule is helpful in systems with a single
> process flow or muiltiple parallel process flows (through different
> cells).
This is not what it’s for, nor where I have seen it work. It is for job
shops. By this I mean shops where you have processing resources through
which you run jobs, and the jobs are varying networks of tasks that can
each be performed by some of the resources with varying process times. The
jobs may even involve dynamic branching in the sense that the outcome of a
task may change what comes next either for the whole job or for part of it.
There may be a high-level sequence of phases that jobs go through, but at
the level of “the herd keeps moving west,” as opposed to “go from this
drill press to that lathe.”
Examples of such shops include:
– The development lab for a manufacturing process.
– Fixture and jig making in a machine shop.
– Repair operations.
– The production of products categorized as “Strangers” in your
Runner/Repeater/Stranger analysis.
The approach applies also to situations that are slightly more repetitive
like machine refurbishment/overhaul, patient processing in health care, or
final test in manufacturing.
The WIP capping/FIFO rule requires little data for production control, but
you still needs the detailed process plan for each job, and it is usually
on a printed traveler with operator check marks for the work already done
and specs on the remaining tasks.
Best regards.
Graphic Representation of a Lean Schedule « Neovista Newsfeed
February 27, 2012 @ 8:58 am
[…] on over here to view the graphic. Share this:PrintEmailFacebookLinkedInTwitterLike this:LikeBe the first to like […]